Download
1 / 15
160 likes | 416 Vues
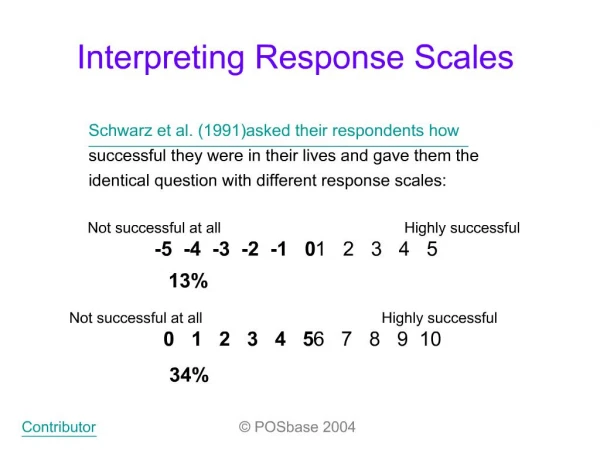
Direct response attitude scales. Marketing manager frequently require information on attitudes of consumers and intermediaries. Egg campaign Polio campaign INS campaign for dailies. Rating scales. Noncomparative Rating Scales:

E N D
Marketing manager frequently require information on attitudes of consumers and intermediaries. • Egg campaign • Polio campaign • INS campaign for dailies
Rating scales • Noncomparative Rating Scales: • Respondent is not provided with a standard to use in assigning the rating. Here respondent does so based on whatever standards seem appropriate. Its also called monadic scales since only one brand or product is evaluated
Rating Scales • Certain , practically certain • Almost sure • Very probably • Probable • Good possibility • Fairly good possibility • Fair possibility • Some possibility • Slight possibility • Very slight possibility • No chance, almost no chance Intention to purchase is generally seen through this scale . Here the respondent is presented with the concept I written, pictorial, or in finished print or television ad form for evaluation
Graphic Noncomparative Rating scales Overall , how would you rate the taste of pepsi Excellent-----------------------------------Very Poor Overall , how would you rate the taste of pepsi Probably Very All Right Not at all Probably the good Neither good. I do the Best I like it good nor not like it worst Although easy to construct, they are not as reliable , and are seldom used in MR.
Itemized Noncomparative Rating Scales (Delighted –Terrible scale) How do you feel about____? I Feel: 7 6 5 4 3 2 1 Delighted Pleased mostly mixed mostly unhappy terrible satisfied (about equally dissatisfied satisfied and dissatisfied) (Percentage scale) Overall how satisfied have you been with this ___________? 100% 90% 80% 70%...............................................................................................0% Completely satisfied not at all satisfied Need –Semantic Differential To what extent does this _______ meet your needs at this time? Extremely Extremely Well (7) (1) poor
Comparative rating scales • In the graphic and itemised rating scales described previously, the rater evaluates the object without direct reference to a specified standard. This means that different respondents may be applying different standards or reference points. • Eg Compared to the soft drink I generally drink, classic coke is:
Conjoint Analysis • It is a set of techniques designed to measure • The Importance, individual consumer attach to each attribute and their degree of preference to each attribute. • Eg consumer often state that price and quality are more important than image or status, yet people consistently purchase high status brands when lower priced brands of equivalent quality are available. • The above method hence allows direct comparisons of an individual preference across attributes. Eg , the method allows determination of consumer’s willingness to trade a 10% price premium for a 12 months longer warranty or 15 % greater gas mileage.
Approaches to conjoint analysis • Tradeoff Matrices: Although initially used, it has lost favor in applied research studies. One reason for its early popularity was the ease of designing the study compared to that of the full profile alternative. • Full profile conjoint: It involves presenting the respondent with a set of product description such that each description contains information on the level of each products. (This generally is done based on soft wares) • Adaptive conjoint analysis (ACA) : It is most widely used. ACA requires respondent to interact with a personal computer. It basically combines some direct preference and importance measures with partial and then full profile conjoint tasks to limit the number of comparisons the respondent must make to those most relevant to each respondent.
Issues in conjoint analysis • A high price/ high status brand/low quality product combination might not be believable and could therefore distort the overall results. • An assumption behind conjoint analysis is that the attributes are more or less independent as perceived by the respondents. • Should price be used as an attribute: eg greeting cards
Perceptual Maps Attribute- Based Approaches Nonattribute- Based Approaches Factor Analysis Correspondence Analysis Discriminant Analysis Similarity Preference
Factor analysis • It is a set of mathematical techniques designed to analyse the inter-relationships among a large number of variables such as consumer ratings of numerous product attributes and to explain these variables in terms of their common underlying dimensions (factors).It has number of applications in marketing. • Developing perceptual maps: To determine broad dimensions or broad criteria by which consumer evaluate brands or products and how each brand is seen on each dimensions
Factor Analysis • Determine the underlying dimensions of the data: Eg a factor analysis of data on TV viewing indicates that there are seven different types of programs that are independent of the network offering them, as perceived by the viewers: movies, adult entertainment, westerns, family entertainment, adventure plots, unrealistic events and sin • Identifying market segments and positioning products: a factor analysis of data on desires sought on the last vacation taken by 1750 respondents revealed six benefit segments for vacationers: those who vacation for the purpose of 1)visiting friends and relatives and not sight seeing 2)visiting friends and relatives plus sight seeing 3) sightseeing 4)outdoor vacationing 5)resort vacationing 6)foreign vacationing
Factor Analysis • Condensing and simplifying data: In a study of consumer involvement across a number of product categories, 19 items were reduced to the 4 factors of 1)Perceived product importance 2) subjective probability of mispurchase 3) the pleasure associated with owning and using the product 4)the value of the product as a cue to the type of person who owns it • Testing hypotheses about the structure of a data set: An application of confirmatory factor analysis in marketing research is its use in determining whether or not the four factors that account for aggregate audience exposure to a daily newspaper, and that those factors represent the public affairs, sports, business, and women’s sections of the newspapers
Cluster Analysis • The basic purpose is to separate objects into groups such that the groups are relatively homogeneous. The basic purpose is in market segmentation. More than one half of the published application in marketing since the late 1960s have been for this purpose. Other application includes its use for test market selection and to establish grouping of products within a product line.