Download
1 / 10
100 likes | 178 Vues
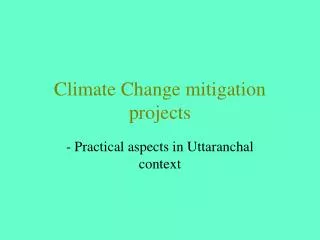
Linking Air Quality and Climate Change Mitigation Objectives: The Case for Controlling Methane. Arlene M. Fiore, Daniel J. Jacob, David G. Streets, Brendan D. Field, Loretta J. Mickley AGU Spring Meeting May 28, 2002. NO x NMVOCs.

E N D
Linking Air Quality and Climate Change Mitigation Objectives: The Case for Controlling Methane Arlene M. Fiore, Daniel J. Jacob, David G. Streets, Brendan D. Field, Loretta J. Mickley AGU Spring Meeting May 28, 2002
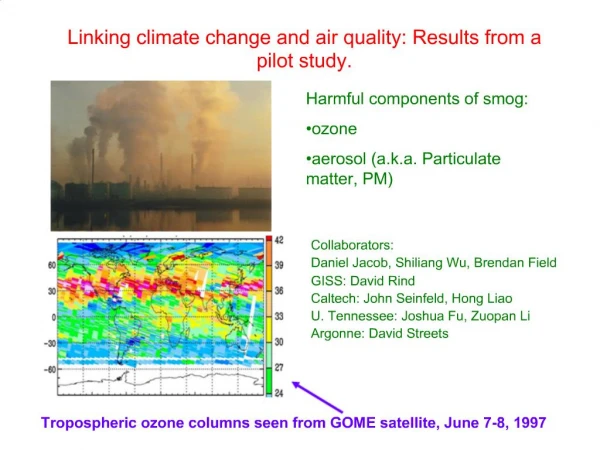
NOx NMVOCs Tropospheric ozone links air pollution & climate change (1) primary constituent of smog in surface air [NRC, 1991] (2) 3rd most important greenhouse gas [IPCC, 2001] O3 Free Troposphere hn NO NO2 Background O3 OH HO2 Intercontinental Transport Boundary layer (0-2.5 km) VOC, CH4, CO Chemical loss Deposition NOx NMVOCs O3 O3 CONTINENT 1 CONTINENT 2 OCEAN
APPROACH:Examine impacts on climate & air quality via simulations with perturbed emissions in GEOS-CHEM TOOL:GEOS-CHEM 3D Tropospheric Chemistry Model MODEL EVALUATION: Mean July 1995 1-5 p.m. O3 (ppbv) in U.S. surface air Model Bias: 2 ppbv, r2 = 0.7 GEOS-CHEM captures: regional high-O3 episodes, observed O3vs. (NOy-NOx), observed tightening of O3 distribution from 1980 to 1995
METHOD:Use GEOS-CHEM to conduct a series of sensitivity simulations with perturbed emissions 1. Implement IPCC A1/B1 future emission scenarios for 2030 A1 2030 Percent change in anthrop. emis. from 1995 base case to 2030 A1 simulation: GLOBAL increase USA decrease CO CH4 NOx VOCs • 2. Reduce various combinations of anthrop. emissions by 50% globally relative to 1995 base year • CH4 fixed at steady-state global uniform concentration • (1700 ppbv for 1995)
Change in radiative forcing* (W m-2) from O3and CH4 relative to 1995 base case NOx OH CH4 50% anthr. NMVOC 50% anthr. CH4 50% anthr. NOx 2030 A1 *calculated from changes in global CH4 concentrations [IPCC, 2001] and changes in the mean tropospheric O3 column [Mickley et al., 1999]
Change in summer afternoon O3 in surface air over the U.S. Relative to 1995 base year (mean 51 ppbv, background 23 ppbv) Mean O3 Background O3* Change in O3 (ppbv) Degradation of U.S. air quality from rise in global emissions despite domestic reductions 50% anthr. NMVOC 50% anthr. CH4 50% anthr. NOx 2030 A1 *produced outside the North American boundary layer (surface-760 hPa)
Impacts of Emissions Perturbations on U.S. Air Quality Number of summer grid-square days with O3 > 80 ppbv Increase in U.S. pollution events despite domestic decline in anthrop. emissions 50% anthr. VOC 50% anthr. CH4 50% anthr. NOx 2030 A1 1995 (base)
Rising emissions from developing countries lengthen the O3 pollution season in the United States 1995 Base Case 2030 A1
NOx NMVOCs Methane emissions reductions lower global O3 background and improve air quality everywhere Free Troposphere CH4 emissions global impact: Lower background O3 Negative radiative forcing CH4 Intercontinental transport, global O3 background increases in 2030 A1 simulation O3 Boundary layer (0-2.5 km) NOx emissions local impact; little effect on climate Chemical loss Deposition NOx NMVOCs O3 O3 CONTINENT 1 CONTINENT 2 OCEAN
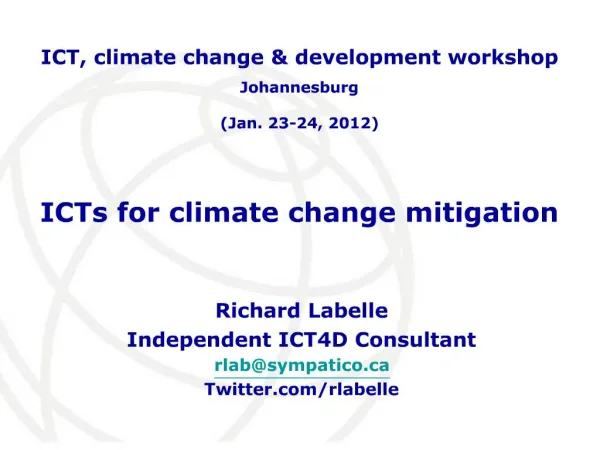
IPCC Projections of Future Methane Emissions to 2050 900 Scenarios A1B A1T A1F1 A2 B1 B2 IS92a 800 CH4 emissions (Tg CH4) 700 600 2000 2040 2020 Year Can we aim to decrease CH4 emissions?