Download
1 / 25
250 likes | 255 Vues
This presentation provides an overview of the FY02 ASA, including customer perspective, internal business processes, learning and growth perspective, and financial perspective. It includes customer segmentation, customer satisfaction measures, process measures, analysis of readiness conclusions, and unique financial measures.

E N D
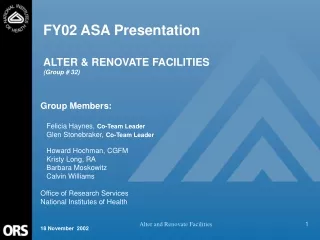
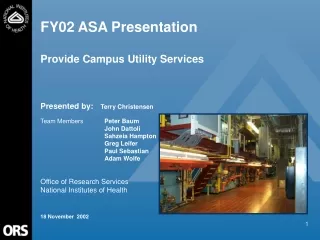
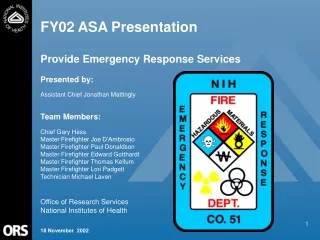
FY02 ASA Presentation List your Service Group Presented by: List Presenters Office of Research Services National Institutes of Health 18 November 2002
Table of Contents Main Presentation ASA Template ……………………………….……………………………….4 Customer Perspective……………………….……………………………….5 Customer Segmentation …………………….……………………………………6 Customer Satisfaction……………………….…………………………………….7 Unique Customer Measures………………….…………………………………..8 Internal Business Process Perspective…………………………………….9 Service Group Block Diagram…………………………………………………..10 Conclusions from Discrete Services Deployment Flowcharts……………….11 Process Measures………………………………………………………………..12 Learning and Growth Perspective………………………………………….13 Conclusions from Turnover, Sick Leave, Awards, EEO/ER/ADR Data……..14 Analysis of Readiness Conclusions…………………………………………….15 Unique Learning and Growth Measures………………………………………..16 Financial Perspective………………………………………………………..17 Unit Cost……………………………………………………………………………18 Asset Utilization……………………………………………………………………19 Unique Financial Measures..……………………………………………………..20 Conclusions and Recommendations……………………………………….21 Conclusions from FY02 ASA..……………………………………………………22 Recommendations…………………………………………………………………23
Table of Contents Appendices Page 2 of your ASA Template Customer segments graphs Customer satisfaction graphs Block diagram Process maps Process measures graphs Learning and Growth graphs Analysis of Readiness Information Unit cost graphs Asset utilization graphs Any unique measures graphs
Customer Segmentation • Insert bullet statements summarizing findings or insert customer segmentation graph(s)
Customer Satisfaction • Insert bullet statements summarizing ORS Customer Scorecard findings or insert customer satisfaction radar chart(s) or scatter diagram
Unique Customer Measures • Insert bullet statements summarizing findings or insert graphs if informative
Service Group Block Diagram • Discuss relationships between Service Group and discrete services • Insert block diagram if informative
Conclusions from Discrete Services Deployment Flowcharts • Our Service Group completed _____ deployment flowcharts for _____ discrete services • Summarize what you learned from the deployment flowcharts
Process Measures • List process measures for each discrete service • DS1: • DS2: • DS3: • DS4: • Bullet statements of findings from process measures data
Conclusions from Turnover, Sick Leave, Awards, EEO/ER/ADR Data • Bullets of conclusions from Learning and Growth Data
Analysis of Readiness Conclusions • Bullets of highlights of major findings
Unique Learning and Growth Measures • If added unique measures, list them • Bulleted statements of conclusions from data • Insert graphs of unique Learning and Growth measure(s) if insightful
Unit Cost Measures • List unit cost measures for each discrete service • Bulleted statements of conclusions from unit cost measures • Insert graphs of unit cost data if insightful
Asset Utilization Measures • List asset utilization measures for each discrete service • Bulleted statements of conclusions from asset utilization measures • Insert graphs of asset utilization data if insightful
Unique Financial Measures • If added unique measures, list them • Bulleted statements of conclusions from data • Insert graphs of unique measure(s) if insightful
Conclusions from FY02 ASA • List major findings from the FY02 ASA • List any improvements already implemented
Recommendations • List actions team plans to take to implement change • Dates on which to move forward with changes • If higher authority is required, clearly identify decisions needed and by whom
Appendices • Include the following: • Page 2 of your ASA Template • Customer segments graphs • Customer satisfaction graphs • Block diagram • Process maps • Process measure graphs • Learning and Growth graphs • Analysis of Readiness Information • Unit cost graphs • Asset utilization graphs • Any unique measures graphs