Download
1 / 50
500 likes | 622 Vues
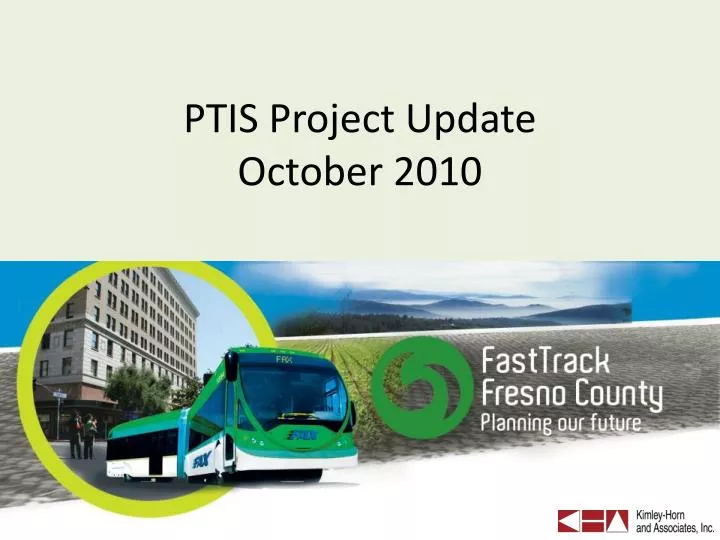
PTIS Project Update October 2010. PTIS Project Objective. Recommend transit investments and land use strategies for urban and rural Fresno County to create a sustainable future. Bus Rapid Transit FTA Application. Personal Rapid Transit test case at CSU Fresno.

E N D
PTIS Project Objective Recommend transit investments and land use strategies for urban and rural Fresno County to create a sustainable future.
Bus Rapid Transit FTA Application Personal Rapid Transit test case at CSU Fresno Submitted September 2010 for service on Blackstone and Ventura/Kings Canyon
PRT Test Case - CSU Fresno Campus PRT Cost Estimate: $30m to $35m/mile to build + $4.3m/yr for O&M
Rural Fresno County Components Selma Walkability and Bikeability Survey Fresno to Kingsburg Transit Supportive Density Assessment
Fresno Existing Conditions • 2010 Population: 502,000 • 2035 Population: 1.4 million • 2.5 du/ac - Fresno County • 7.8 du/ac - City of Fresno • 91.6% car trips • 0.84% transit trips • 7.6% walk/bike trips • Very little congestion • 5th most polluted airshed in the US
Recommended Transit Priorities (From the Economist) Tier A Tier B Tier C
Development of 5 Transportation and Land Use Scenarios: 1. 5 Year Plan 2. 20 Year Plan • COG Trend Scenario • Constrained TOD Scenario • Aggressive TOD Scenario
Existing FAX transit system is the baseline included in every future transit scenario.
Capital Cost of Transit Improvements • 5 Year Plan including BRT on Blackstone/Ventura =$46.8M* • 5 Year + 20 Year Plans= $251M * • Add BRT on Shaw Ave = $440M * * Does not include the cost of operating service (wages, gas, maintenance, etc.) Includes fleet replacement cost of $150M twice over 25 years. Stated in 2010 dollars.
5 Year Plan vs 20 Year PlanVehicle Miles Travelled VMT doubles from 18 million trips in 2003 to 37 million trips in 2035. VMT grows faster than the population under the current land use trends.
Three Land Use Scenarios: 2035 • COG Trend Scenario 2. Constrained TOD Scenario 3. Aggressive TOD Scenario
Our Question: “What effect does development density and mix have on people’s travel behavior in specific transit corridors and downtown?”
COG Trend Scenario Build Scenario
COG trend Scenario:Based on adopted zoninglow density fringe growthAssumes SEGA is built out
Constrained TOD Scenario Constrained TOD
Constrained TOD Scenario:TOD Housing is market constrainedAssumes SEGA is built out: growth on the fringes
TOD Demand in Fresno County 14% of all households 73,000 households in 2035 Source: US Census ACS 2005-2007; California Department of Finance, 2010; Strategic Economics, 2010
TOD Demand by Income 60% of TOD demand (43,000 units in 2035) is from households with low and very low incomes. Source: US Census ACS 2005-2007; California Department of Finance, 2010; Strategic Economics, 2010
Market-rate multi-family housing likely to be targeted to higher income households Only 40% of TOD households (30,000 in 2035) can afford newly built, market-rate higher density units. Demand for Multifamily Units by Income Source: US Census ACS 2005-2007; California Department of Finance, 2010; Strategic Economics, 2010
Developer Perspective Higher density housing types are more costly to build, and will take longer to realize. Rehabilitation and reuse can be a good short term strategy to provide additional units at lower cost.
SEGA Planned for 55,000 people. Housing and jobs separated by 5 miles. Fringe growth.
Aggressive TOD Scenario Full Build Out TOD
Aggressive TOD Scenario:TOD Housing is market not constrainedAssumes SEGA is not built: growth moves to transit corridors
Percentage of housing units and jobs in mixed-use buildings COG Trend Constrained TOD Aggressive TOD
Housing - Within 1 ½ Miles of BRT and Streetcar COG Trend Constrained TOD Aggressive TOD
Employment - Within 1 ½ Mile of BRT and Streetcar COG Trend Constrained TOD Aggressive TOD
Downtown Fresno Grows: 2003 to 2035 • From 3,400 homes to 20,500 homes • From 31,500 jobs to 70,000 jobs • From 3.73% of work trips on transit to 8.5%
Conclusions • We can make a big difference in travel behavior in a few well-planned priority transit corridors. • Constrained TOD with dedicated lanes seems to be the most realistic scenario of what can be achieved. • Downtown Fresno needs to be the top priority for investment and redevelopment.
Bus Rapid Transit or Light Rail Transit Top Priority Transit Corridors Streetcar
Transit Technology Future • BRT may be upgraded to LRT on Blackstone (constrained TOD scenario) if >12 du/ac density is achieved. • BRT vehicles can be repositioned to Shaw Avenue to create the 3rd corridor. • Streetcars and High Speed Rail are operating downtown and interfacing directly with LRT and BRT lines out to the suburbs.
Increase the number of people and businesses in close proximity to designated high-capacity transit corridors and downtown. • Plan for and build TOD housing developments that meet the needs of a mix of middle to lower incomes and families. • Restrict the growth of new development on the urban fringes and into farmlands with incentives, disincentives and urban growth boundaries.
Grow the transit, bicycle and pedestrian mode shares by making it more attractive to use alternate modes. • Decrease the automobile mode share and VMT by making it less attractive to drive a car in Fresno. • Attract new residents to Fresno who will more likely want to live in TOD-style market-priced development, including young urban professionals, seniors, and future high speed rail commuters.
8. Create processes that cross jurisdictional and departmental boundaries to link transportation and land use planning decisions together.
PTIS Next Steps • Downtown Streetcar operating plan, cost estimates and economic impacts analysis • Transit Technology recommendations, operating plan, investment phasing • Refine Policy Recommendations • Final Report to COG by January 2011