Download
1 / 21
210 likes | 223 Vues
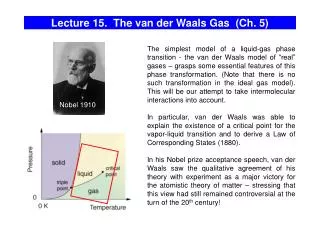
Lecture 15. Phases of Pure Substances (Ch.5).

E N D
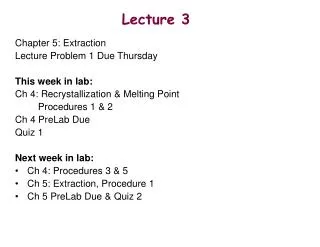
Lecture 15. Phases of Pure Substances (Ch.5) Up to now we have dealt almost exclusively with systems consisting of a single phase. In this lecture, we will learn how more complicated, multi-phase systems can be treated by the methods of thermodynamics. The guiding principle will be the minimization of the Gibbs free energy in equilibrium for all systems, including the multi-phase ones.
The Coexistence Curves Along the coexistence curves, two different phases 1 and 2 coexist in equilibrium (e.g., ice and water coexist at T = 00C and P = 1bar). The system undergoes phase separation each time we cross the equilibrium curve (the system is spatially inhomogeneous along the equilibrium curves). Any system in contact with the thermal bath is governed by the minimum free energy principle. The shape of coexistence curves on the P-T phase diagram is determined by the condition: and, since - otherwise, the system would be able to decrease its Gibbs free energy by transforming the phase with a higher into the phase with lower . Two phases are in a state of diffusive equilibrium: there are as many molecules migrating from 1 to 2 as the molecules migrating from 2 to 1. - as for any two sub-systems in equilibrium Also for equilibrium between the phases: - the phase boundary does not move Though G is continuous across the transition, H demonstrates a step-like behavior: (different phases have different values of the entropy)
Example: the Gas-Liquid Transformation slope of G(T) depends on entropy of the phase Table on page 404 (a very useful source of information) provides the values of H and G for different phases of many substances. The data are provided per mole, at T=298 K and P=1 bar. For example, let’s check that at the boiling point, the values of G for liquid water and water vapor are equal to each other: 0 liquid gas phase transformation T S(water) = 70 J/K S(vapor) = 189 J/K
Phases of Carbon The phase equilibrium on the P,T-plane is determined by or At normal conditions, graphite is more stable than diamond: G(graphite) = 0, G(diamond) = 2.9 kJ (diamonds are not forever...). What happens at higher pressures? - since the molar volume of graphite is greater than the molar volume of diamond, G(graphite) will grow with pressure faster than G(diamond) [we neglected V = V(P)] G diamond graphite D. becomes more stable than G. only at P > 1.5 GPa T = 300K 2.9 kJ With increasing T, the pressure range of graphite stability becomes wider: 1 2 P (GPa) G diamond 2.9 kJ graphite P = 1 bar S(graphite) = 5.74 J/K, S(diamond) = 2.38 J/K, 800 1300 T (K) 300
S T=T1 = const gas gas+liquid liquid liquid+solid solid P The First-Order Transitions The transitions which displays a jump in entropy and a latent heat associated with this jump are called the first-order phase transitions. T1 critical point S Sgas beyond critical point, gas is indistinguishable from liquid mixed phase The “evaporation” L is generally greater than the “melting” L (the disorder introduced by evaporation is greater than that introduced by melting). Sliquid T TC temperature Q: Can the critical point exist along the melting coexistence curve?
G T S S = L/T T The First-Order Transitions (cont.) Note that in the first-order transitions, the G(T) curves have a real meaning even beyond the intersection point, this results in metastability and hysteresis. There is usually an energy barrier that prevents a transition occurring from the higher to the lower phase (e.g., gas, being cooled below Ttr does not immediately condense, since surface energy makes the formation of very small droplets energetically unfavorable). G P,N = const solid liquid gas T (Pr. 5.9). L. water can exist at T far lower than the freezing temperature: water in organic cells can avoid freezing down to –200C in insects and down to –470C in plants. CP On the graph G(T) at P,N = const, the slope dG/dT is always negative: T
Problem The entropy of water at atmospheric pressure and 1000C is 1.3 J/g·K, and the entropy of water vapor at the same T and P is 7.4 J/g K. • What is the heat of vaporization at this temperature? • The enthalpy of vapor under these conditions is • 2680 J/g. Calculate the enthalpy of water under these conditions. • (c) Compute the Gibbs free energies of water and steam under these conditions. • The heat of vaporization: L = TS = 373K6.1 J/g·K=2275 J/g • The differential of enthalpy dH = TdS+VdP. Hence, • Hwater = Hvapor – TΔS = Hvapor – L= (2680-2275)J/g = 405 J/g • (c) Since G = H-TS, • Gwater = Hwater –TSwater = 405J/g - 373K 1.3J/g·K = -80J/g • Gvapor = Hvapor –TSvapor = 2680J/g - 373K 7.4J/g·K = -80J/g
The Second Order Transitions Second-order transition G T S S=0 T CP T
The Clausius-Clapeyron Relation P Along the phase boundary: phase boundary P T T For the slope of the boundary we have: Since S1 -S2 = L/T(L is the latent heat), we arrive at the Clausius-Clapeyron Relation :
1 kg of water at 200C is converted into ice at -100C (all this happens at P = 1 bar). The latent heat of ice meltingLmelt = 334 kJ/kg,the heat capacity of water at constant pressure is 4.2 kJ/(kg·K) and that of ice 2.1 kJ/(kg·K). (a) What is the total change in entropy of the water-ice system? (b) If the density of water at 00C is taken as 10% greater than that of ice, what is the slope of the melting curve of ice at this temperature? Give both sign and size. Problem (a) 1. From 200C to 00C: 2. Melting of ice 3. From 00C to -100C: (b)
The Vapor Pressure Equation The differential Clausius-Clapeyron equation can be solved to find the shape of the entire coexistence curve (Pr. 5.35). • For the liquid-gas phase transition, we can make the following reasonable assumptions: • the molar volume of the liquid is much smaller than that of the gas (neglect Vliquid) • the molar volume of gas is given by the ideal gas law V = RT/P • the latent heat is almost T-independent, L L(T) 4He H2O P (mbar) P (mbar) P (mbar) T (K) T (0C)
Problem (The pressure cooker) The boiling point of water at atmospheric pressure (1 bar) is 373 K, and the latent heat of vaporization at this T is 2.25 MJ/kg. Assuming the latent heat to be constant over the relevant temperature range, that water vapor is an ideal gas, and that the volume of the liquid is negligible relative to that of the vapor, find the temperature inside a pressure cooker operating at an absolute pressure of 2 bar.
Problem For Hydrogen (H2) near its triple point (Ttr=14K), the latent heat of vaporization Lvap=1.01 kJ/mol. The liquid density is 71 kg·m-3, the solid density is 81 kg·m-3, and the melting temperature is given by Tm =13.99+P/3.3, where Tm and P measured in K and MPa respectively. Compute the latent heat of sublimation Near the triple point: P solid liquid Ptr gas T Ttr
Problem (cont.) P solid liquid The vapor pressure equation for H2: where P0 = 90 MPa . Compute the slope of the vapor pressure curve (dP/dT) for the solid H2 near the triple point, assuming that the H2 vapor can be treated as an ideal gas. Ptr gas T Ttr At the solid-gas phase boundary: Assuming that the H2 vapor can be treated as an ideal gas
Phase Diagram of H2O For most “normal” substances, the slope of the melting curve is positive (SL>SS, VL>VS). The phase diagram for water shows the characteristic negative slope of the solid-liquid equilibrium curve. The ice is less dense than water (VL<VS): the hydrogen bonds determine the tetrahedral coordination and openness of the structure of ice. As ice melts into water the change in entropy (or the latent heat) is positive, while the change in volume is negative, hence the negative slope. Ice I The negative slope of the solid-liquid coexistence curve makes ice skating possible: ice melts under the pressure exerted by the skate blade. The Clausius-Clapeyron equation provides the connection between ice skating and the observation that ice floats on water.
Problem Ice skating becomes unpleasant if the weather is too cold so that the ice becomes too “hard”. Estimate the lowest temperature for which ice skating is still enjoyable for a person of normal weight. The given data are that the latent heat of fusion of water is 333 J/g, that the density of liquid water is 1 g/cm3, and that ice cubes float with ~9/10 of their volume submerged. The lowest temperature for enjoyable skating is the temperature at which the pressure exerted by the skater on ice is equal to the pressure on the coexistence curve at this T. At P0=1 bar, ice melts at T0= 273.15K (=00C). pressure: The lowest temperature: - 80C, about right. Let’s verify that from two points on the melting curve, (0.006 bar 273.16K) and (1 bar 273.15K) we can get a reasonable estimate for L:
Why Is Ice Slippery? (R. Rosenberg, Physics today, Dec. 2005) Pressure melting does not explain why skating is possible in climates as cold as –30oC. This popular explanation of the thermodynamics of ice skating is not the whole story (the experiments by Robert Wood and other researchers). The mechanism(s) is much more complicated. The physicists interested in the problem: Faraday, Gibbs, etc. Two other important factors: Frictional heating. S. Colbeck in his experiments (1988-1997) attached a thermocouple to a skate blade (and to the bottom of skis) and showed that the increase in temperature with velocity was consistent with frictional heating. Liquid layer on ice surface below zero. There is a disordered (liquid-like) layer on the surface of ice (its thickness - ~ 10 nm) down to ~ -30oC.
Phase Diagrams of 4He • Helium is the only element that remains a liquid at T=0 and P =1 bar because: • the zero-point oscillations of light atoms are large, • the binding forces between the atoms are very weak. 4He the “” transition According to Nernst’s theorem, for any processes that bring a system at T = 0 from one equilibrium state to another, S = 0. If, at the same time, V 0, then dP/dT = 0, and the slope of the coexistence curve “solid-liquid” must approach zero as T 0.
S Ssolid SLiquid 0.32K T Phase Diagram of 3He P 3He Solid Liquid Gas linear scale T Below 0.3K the slope of the 3He solid-liquid phase boundary is negative. This negative slope tells us that S and V have opposite signs. The denser phase is always the one that is stable at high P – its molar volume is smaller, and at sufficiently high P, its G is smaller. When we move from liquid 3He to solid 3He, V decreases - thus, S must increase!! Pr. 7.26 In other words, the liquid is more “ordered” than the solid, and therefore it takes heat to change the liquid to a solid! The Pomeranchuk effect: as the solid-liquid mixture is compressed, heat is removed from the liquid phase as crystals form. The latent heat associated with converting 1 mole of 3He liquid into solid is 0.42J. Cooling: from ~ 20 mK to 2 mK.
Lmelt Tmin T At the atmospheric pressure, 3He remains liquid even at T=0. The minimum pressure of 3He solidification is Pmin= 28.9 bar. At low temperatures, the entropy of 1 mole of liquid 3He is SL= RT/T0, where T0=0.22 K, the entropy of solid 3He is temperature-independent: SS = R ln2. The difference between the molar volumes of liquid and solid 3He V = VL-VS = 1.25 cm3/mol Problem • Find the temperature of solidification Tmin at P =Pmin • Find the temperature dependence of the latent heat of melting Lmelt. • Find the pressure of solidification of 3He at T = 0. The minimum on the solid-liquid coexistence curve (P= Pmin)corresponds to dP/dT = 0, and, thus, Lmelt(Tmin) =0. (a) (b) - a parabola that goes through 0 at T = Tmin. The negative sign of Lmelt for 3He is a unique phenomenon (the Pomeranchuk effect). Over the range of T where Lmelt < 0, the slope of the L-S coexistence curve is negative. (Note that, in contrast to dPmelt/dT < 0 on the phase diagram for water, here the negative slope is observed for VL-VS > 0). Pmelt (c) By integrating the Cl.-Cl. eq. Tmin T
Summary 1. The shape of coexistence curves on the P-T diagram: 2. The latent heat in the 1st order phase transitions: 3. The slope of the coexistence curve is given by the Clausius-Clapeyron Relation: By integrating the CC relation, one can restore the shape of the coexistence curve, P(T) 4. For the gas-liquid transition, we can replace the CC relation with the vapor equation: 5. The triple point: