Download
1 / 1
10 likes | 161 Vues
Period-Luminosity Relations for Small Magellanic Cloud Cepheids Based on AKARI Archival Data. Danielle M. Citro 1 , Choong-Chow Ngeow 2 , Shashi M. Kanbur 1 , J. Bennett 1 , B. Barrett 1 1 Physics Department, SUNY Oswego, 2 National Central University Taiwan.

E N D
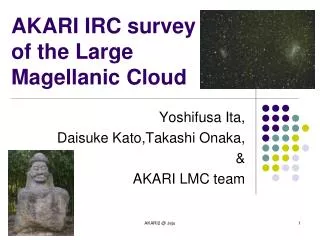
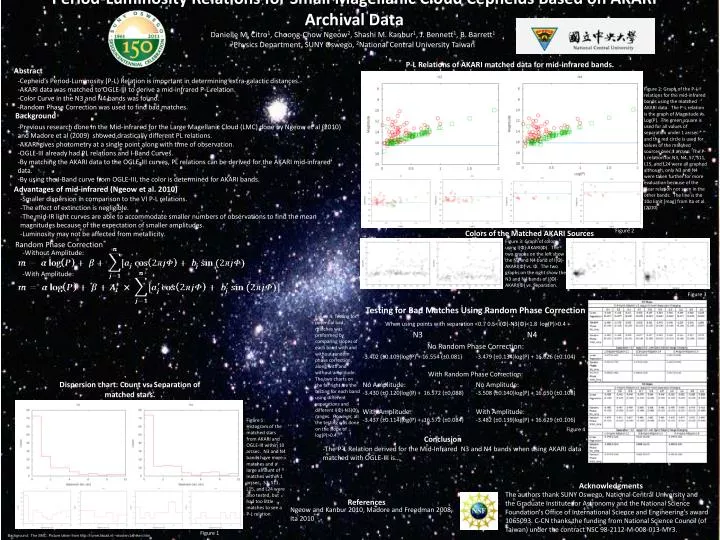
Period-Luminosity Relations for Small Magellanic Cloud Cepheids Based on AKARI Archival Data Danielle M. Citro1, Choong-Chow Ngeow2, Shashi M. Kanbur1, J. Bennett1, B. Barrett1 1Physics Department, SUNY Oswego, 2National Central University Taiwan P-L Relations of AKARI matched data for mid-infrared bands. Abstract -Cepheid’s Period-Luminosity (P-L) Relation is important in determining extra-galactic distances. -AKARI data was matched to OGLE-III to derive a mid-infrared P-L relation. -Color Curve in the N3 and N4 bands was found. -Random Phase Correction was used to find bad matches. Figure 2: Graph of the P-L relations for the mid-infrared bands using the matched AKARI data. The P-L relation is the graph of Magnitude vs. Log(P). The green square is used for all values of separation under 1 arcsec and the red circle is used for values of the matched sources over 1 arcsec. The P-L relation for N3, N4, S7, S11, L15, and L24 were all graphed although, only N3 and N4 were taken further for more evaluation because of the clear relation not seen in the other bands. The line is the 10σ limit [mag] from Ita et al. (2010) Background -Previous research done in the Mid-infrared for the Large Magellanic Cloud (LMC) done by Ngeow et al (2010) and Madore et al (2009) showed drastically different PL relations. -AKARI gives photometry at a single point along with time of observation. -OGLE-III already had PL relations and I-Band Curves. -By matching the AKARI data to the OGLE-III curves, PL relations can be derived for the AKARI mid-infrared data. -By using the I-Band curve from OGLE-III, the color is determined for AKARI bands. Advantages of mid-infrared (Ngeow et al. 2010) -Smaller dispersion in comparison to the VI P-L relations.-The effect of extinction is negligible.-The mid-IR light curves are able to accommodate smaller numbers of observations to find the mean magnitudes because of the expectation of smaller amplitudes.-Luminosity may not be affected from metallicity. Figure 2 Colors of the Matched AKARI Sources Figure 3: Graph of colors using I(Φ)-AKARI(Φ). The two graphs on the left show the N3 and N4 band of I(Φ)-AKARI(Φ) vs. Φ. The two graphs on the right show the N3 and N4 bands of I(Φ)-AKARI(Φ) vs. Separation. Random Phase Correction -Without Amplitude: -With Amplitude: Figure 3 Figure 4: Testing for potential bad matches was preformed by comparing slopes of each band with and without random phase correction, along with and without amplitude. The two charts on the far right are the testing for each band using different separations and different I(Φ)-N3(Φ) ranges. However, all the testing was done on the slope of log(P)>0.4. Dispersion chart: Count vs. Separation of matched stars. Figure 1: Histogram of the matched stars from AKARI and OGLE-III within 10 arcsec. N3 and N4 bands have more matches and a large amount of matches within 1 arcsec. S7, S11, L15, and L24 were also tested, but had too little matches to see a P-L relation. Figure 4 Conclusion -The P-L Relation derived for the Mid-Infrared N3 and N4 bands when using AKARI data matched with OGLE-III is… Acknowledgments The authors thank SUNY Oswego, National Central University and the Graduate Institute for Astronomy and the National Science Foundation's Office of International Science and Engineering's award 1065093. C-CN thanks the funding from National Science Council (of Taiwan) under the contract NSC 98-2112-M-008-013-MY3. References Ngeow and Kanbur 2010, Madore and Freedman 2008, Ita 2010 Figure 1 Background: The SMC. Picture taken from http://home.tiscali.nl/~slooten/zafriken.htm