Download
1 / 22
220 likes | 344 Vues
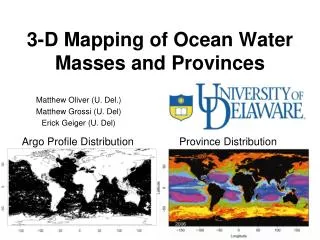
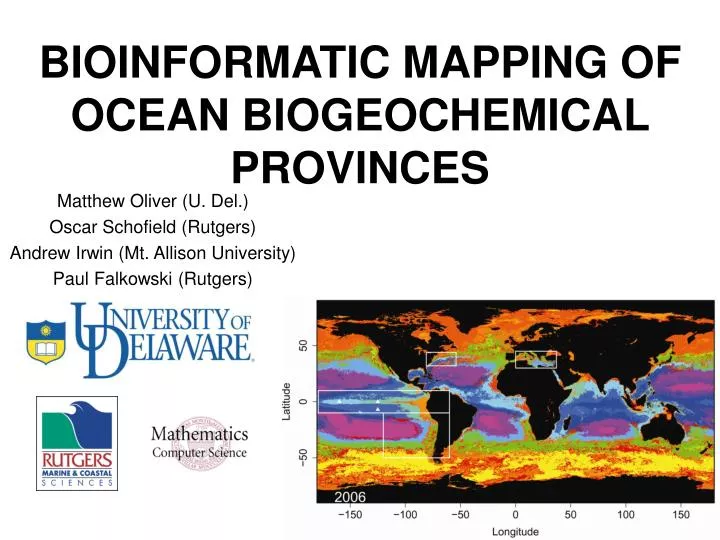
BIOINFORMATIC MAPPING OF OCEAN BIOGEOCHEMICAL PROVINCES. Matthew Oliver (U. Del.) Oscar Schofield (Rutgers) Andrew Irwin (Mt. Allison University) Paul Falkowski (Rutgers). Static, manual provinces. Longhurst (1995, 1998, 2006). Questions. Can We Make Dynamic Provinces (space-time variant)?

E N D
BIOINFORMATIC MAPPING OF OCEAN BIOGEOCHEMICAL PROVINCES Matthew Oliver (U. Del.) Oscar Schofield (Rutgers) Andrew Irwin (Mt. Allison University) Paul Falkowski (Rutgers)
Static, manual provinces Longhurst (1995, 1998, 2006)
Questions • Can We Make Dynamic Provinces (space-time variant)? • Why? • Biome boundaries are predictive of hydrography • Changes in biome size and distributions are bellwethers for cyclical and secular earth cycles • True comparative analysis by controlling for advection (ie making provinces a quantitative measurement)
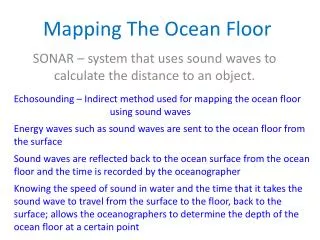
Automatic unsupervised classification Oliver et al (2004) JGR Oceans SeaWiFSMODIS/AquaAVHRR SST
ENSO indexes Province areas (sum of 3) 2003 Jan 2006 Dec
Jan 2006 Gyre area Jan 1998 To Dec 2006
Jan 2006 Gyre area Jan 1998 To Dec 2006
Combined Global Gyres Total C fixation (g / d) Trend Combined Tropical Seas Jan 1998 Dec 2006
Informational Content in MODIS and Sea-WiFS/AVHRR are highly similar
Where are we? Have a verified method to make dynamic and quantitative maps Automatic Biomes reflect expert knowledge Biomes are change in response to well known global processes Biomes are being used to find cyclical and secular change in the ocean environment Comparative analysis of primary production in provinces
Where are we going? • Iron Dust Impacts? • Linking MODIS and Sea-WiFS/AVHRR records together • Biomes/Water Masses as Fisheries Indicators • Adding 3-D Structures to Biomes
Iron Limited Nitrogen Limited 0% 1% 2% 3% 4% 5% -2 -1 0 1 2 φsat-NPQ Nutrient Stress Index
Iron Limited Nitrogen Limited 0% 1% 2% 3% 4% 5% -2 -1 0 1 2 φsat-NPQ Nutrient Stress Index
Where are we going? • Iron Dust Impacts? • Linking MODIS and Sea-WiFS/AVHRR records together • Biomes/Water Masses as Fisheries Indicators • Adding 3-D Structures to Biomes
Where are we going? • Iron Dust Impacts? • Linking MODIS and Sea-WiFS/AVHRR records together • Biomes/Water Masses as Fisheries Indicators • Adding 3-D Structures to Biomes
Contact Us Andrew Irwin: airwin@mta.ca Poster 227 Matt Oliver: moliver@udel.edu Poster 218 Oliver et al (2004) JGR Oceans