Download
1 / 1
10 likes | 89 Vues
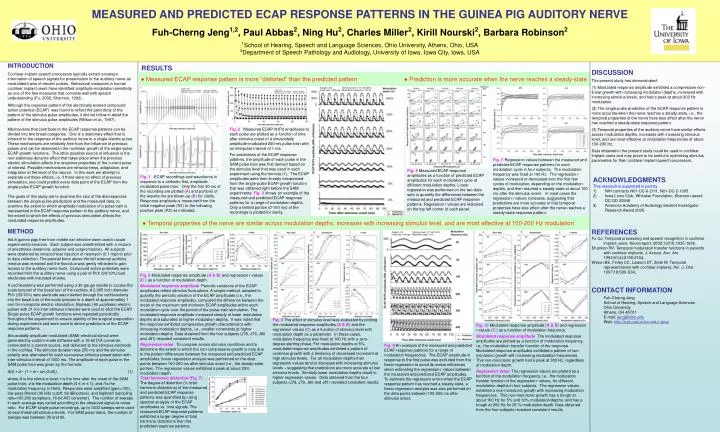
MEASURED AND PREDICTED ECAP RESPONSE PATTERNS IN THE GUINEA PIG AUDITORY NERVE Fuh-Cherng Jeng 1,2 , Paul Abbas 2 , Ning Hu 2 , Charles Miller 2 , Kirill Nourski 2 , Barbara Robinson 2 1 School of Hearing, Speech and Language Sciences, Ohio University, Athens, Ohio, USA

E N D
MEASURED AND PREDICTED ECAP RESPONSE PATTERNS IN THE GUINEA PIG AUDITORY NERVE Fuh-Cherng Jeng1,2, Paul Abbas2, Ning Hu2, Charles Miller2, Kirill Nourski2, Barbara Robinson2 1School of Hearing, Speech and Language Sciences, Ohio University, Athens, Ohio, USA 2Department of Speech Pathology and Audiology, University of Iowa, Iowa City, Iowa, USA INTRODUCTION Cochlear implant speech processors typically extract envelope information of speech signals for presentation to the auditory nerve as modulated trains of electric pulses. Behavioral measures in human cochlear implant users have identified amplitude-modulation sensitivity as one of the few measures that correlate well with speech understanding (Fu, 2002; Shannon, 1992). Although the response pattern of the electrically evoked compound action potential (ECAP) was found to reflect the periodicity of the pattern of the stimulus pulse amplitudes, it did not follow in detail the pattern of the stimulus pulse amplitudes (Wilson et al., 1997). Mechanisms that contribute to the ECAP response patterns can be divided into two broad categories. One is a stationary effect that is inherent to the response of the auditory nerve to a single electric pulse. These mechanisms are relatively free from the influence of previous pulses and can be observed in the nonlinear growth of the single-pulse ECAP growth functions. The other possible source of influence is the non-stationary dynamic effect that takes place when the previous electric stimulation affects the response properties of the current pulse of interest. Possible mechanisms are refractoriness, adaptation, and integration at the level of the neuron. In this work we attempt to separate out these effects, i.e. if there were no effect of previous stimulation, one could predict every data point of the ECAP from the single-pulse ECAP growth function. The goals of this study are to examine the size of the discrepancies between the single-pulse predictions and the measured data, to examine the extent to which amplitude modulation of a pulse train is represented in the ECAP response pattern in the auditory nerve, and the extent to which the effects of previous stimulation affects the modulated response amplitudes. METHOD Adult guinea pigs free from middle ear infection were used in acute experimental sessions. Each subject was anesthetized with a mixture of anesthesia (ketamine, xylazine and acepromazine). All subjects were deafened by intracochlear injection of neomycin (0.1 mg/ml) prior to data collection. The parietal bone above the left external auditory meatus was removed and the flocculus was gently retracted to gain access to the auditory nerve trunk. Compound action potentials were recorded from the auditory nerve using a pair of Pt/Ir (90/10%) ball electrodes with insulated shanks. A cochleostomy was performed using a 30-gauge needle to access the scala tympani of the basal turn of the cochlea. A 0.005 inch diameter Pt/Ir (90/10%) wire electrode was inserted through the cochleostomy into the basal turn of the scala tympani to a depth of approximately 1 mm for monopolar electric stimulation. Biphasic (40 s/phase) electric pulses with 31-ms inter-stimulus intervals were used to elicit the ECAP. Single-pulse ECAP growth functions were repeated periodically throughout the experiment to ensure stability of the surgical preparation during experiments and were used to derive predictions of the ECAP response patterns. Sinusoidally amplitude-modulated (SAM) electrical stimuli were generated by custom-made software with a 16-bit D/A converter, connected to a current source, and delivered to the stimulus electrode in the cochlea.The stimulus duration was 250 ms and the stimulus polarity was alternated for each successive stimulus presentation with inter-stimulus interval of 1000 ms. The amplitude of each pulse in the SAM pulse train was given by the formula: A(t) = A • (1 + m • sin (2pft)), (1) where A is the stimulus level; t is the time after the onset of the SAM pulse train; d is the modulation depth (0 ≤ m ≤ 1); and f is the modulation frequency in Hertz. Responses were amplified (gain=100), low-pass filtered (30 kHz cutoff, 36 dB/octave), and digitized (sampling rate=100,000 samples/s, 16-bit A/D converter). The number of sweeps in each average was varied according to the observed signal-to-noise ratio. For ECAP single-pulse recordings, up to 1000 sweeps were used at near-threshold stimulus levels. For SAM pulse trains, the number of sweeps was between 30 and 60. RESULTS DISCUSSION The present study has demonstrated: (1) Modulated response amplitude exhibited a compressive non-linear growth with increasing modulation depths, increased with increasing stimulus levels, and had a peak at about 300 Hz modulation. (2) The single-pulse prediction of the ECAP response pattern is more accurate when the nerve reaches a steady-state, i.e., the temporal properties of the nerve have less effect after the nerve has reached a steady-state response pattern. (3) Temporal properties of the auditory nerve have similar effects across modulation depths, increases with increasing stimulus level, and are most effective at modulation frequencies of about 100-200 Hz. Data obtained in the present study could be used in cochlear implant users and may prove to be useful to optimizing stimulus parameters for their cochlear implant speech processors. ● Measured ECAP response pattern is more “distorted” than the predicted pattern ● Prediction is more accurate when the nerve reaches a steady-state Fig. 2 Measured ECAP N1P2 amplitudes to each pulse are plotted as a function of time after stimulus onset of a sinusoidally amplitude-modulated 250-ms pulse train with an interpulse interval of 1 ms. For predictions of the ECAP response patterns, the amplitude of each pulse in the SAM pulse train was first derived based on the stimulus level that was used in each experiment using the formula (1). The ECAP amplitudes were then linearly interpolated from the single-pulse ECAP growth function that was obtained right before the SAM experiments. Fig. 3 shows an example of the measured and predicted ECAP response patterns for a range of modulation depths. Only a limited portion (0-100 ms) of the recordings is plotted for clarity. Fig. 5 Regression values between the measured and predicted ECAP response patterns for each modulation cycle in four subjects. The modulation frequency was fixed at 100 Hz. The regression r values increased or decreased over the first few cycles of modulation, depending on the modulation depths, and then reached a steady-state at about 100 ms after the stimulus onset. In most cases the regression r values increases, suggesting that predictions are more accurate or that temporal properties have less effect after the nerve reaches a steady-state response pattern. Fig. 4 Measured ECAP response amplitudes as a function of predicted ECAP amplitudes for each modulation cycle at different modulation depths. Linear regression was performed on the two data sets to quantify the differences between the measured and predicted ECAP response patterns. Regression r values are indicated on the top left corner of each panel. Fig. 1 ECAP recordings and waveforms in response to a cathodic-first, amplitude modulated pulse train. Only the first 30 ms of the recording are plotted (A) and portions of the waveforms are blown-up (B) for clarity. Response amplitude is measured from the initial negative peak (N1) to the following positive peak (P2) as indicated. • ACKNOWLEDGMENTS • This research is supported in part by • NIH contracts N01-DC-6-2111, N01-DC-2-1005 • Iowa Lions Club, Whitaker Foundation, Shannon award DC/OD 02948 • American Academy of Audiology Student Investigator Research Award 2005. ● Temporal properties of the nerve are similar across modulation depths, increases with increasing stimulus level, and are most effective at 100-200 Hz modulation REFERENCES Fu QJ. Temporal processing and speech recognition in cochlear implant users. Neuroreport, 2002;13(13);1635-1639. Shannon RV. Temporal modulation transfer functions in patients with cochlear implants. J. Acoust. Aoc. Am. 1992;91(4):2156-2164,. Wilson BS, Finley CC, Lawson DT, Zerbi M. Temporal representations with cochlear implants. Am. J. Otol. 1997;18:S30-S34,. Fig. 6 Modulated response amplitude (A & B) and regression r values (C ) as a function of modulation depth. Modulated response amplitude Periodic variations of the ECAP amplitudes reflect stimulus fluctuations. A simple method, adopted to quantify the periodic variation of the ECAP amplitudes (i.e., the modulated response amplitude), computed the difference between the mean of the maximum and minimum ECAP amplitudes within each modulation cycle over the period of the pulse-train stimulation. The modulated response amplitude increased steeply at lower modulation depths and saturated at higher modulation depths. It was noted that the response exhibited compressive growth characteristics with increasing modulation depths, i.e., smaller increments at higher modulation depths. Data obtained from the four subjects (J78, J79, J80 and J81) revealed consistent results. Regression value To compare across stimulus conditions and to determine the extent to which the non-compressive growth is truly due to the pattern differences between the measured and predicted ECAP amplitudes, linear regression analysis was performed on the data points between 100-250 ms after stimulus onset (i.e., the steady-state portion). The regression values exhibited a peak at about 25% modulation depth. • CONTACT INFORMATION • Fuh-Cherng Jeng • School of Hearing, Speech and Language Sciences • Ohio University • Athens, OH 45701 • E-mail: jeng@ohio.edu • Web: http://oak.cats.ohiou.edu/~jeng Fig. 8 The effect of stimulus level was evaluated by plotting the modulated response amplitudes (A & B) and the regression values (C) as a function of stimulus level with modulation depth as a parameter. In these cases, modulation frequency was fixed at 100 Hz with a zero-degree starting phase. For modulation depths of 5%, modulated response amplitudes exhibited a pattern of nonlinear growth with a tendency of decreased increment at high stimulus levels. For all modulation depths their regression values tend to decrease with increasing stimulus levels – suggesting that predictions are more accurate at low stimulus levels. Similarly lower modulation depths result in higher regression values. Data obtained from the four subjects (J78, J79, J80 and J81) revealed consistent results. Fig. 10 Modulated response amplitude (A & B) and regression r values (C ) as a function of modulation frequency. Modulated response amplitude The modulated response amplitudes are plotted as a function of modulation frequency, i.e., the modulation transfer function of the response. Modulated response amplitudes exhibited a pattern of non-monotonic growth with increasing modulation frequencies. This non-monotonic growth had a peak at 300 Hz, regardless of modulation depth. Regression Value The regression values are plotted as a function of the modulation frequency, i.e., the modulation transfer function of the regression r values, for different modulation depths in four subjects. The regression values exhibited a non-monotonic growth with increasing modulation frequencies. This non-monotonic growth has a trough at about 100 Hz for 5% and 10% modulation depths, and has a trough at 200 Hz for 25 % modulation depth. Data obtained from the four subjects revealed consistent results. Fig. 9 An example of the measured and predicted ECAP response patterns for a range of modulation frequencies. The ECAP amplitude in response to the first pulse was excluded from the linear regression to avoid its undue influences when estimating the regression r values between the measured and predicted ECAP amplitudes. To estimate the regression errors when the ECAP response pattern has reached a steady-state, a linear regression analysis was also performed on the data points between 100-250 ms after stimulus onset. Total harmonic distortion (Fig. 7)The degree of distortion (% total harmonic distortions) of the measured and predicted ECAP response patterns was quantified by using spectral analysis of the ECAP amplitudes vs. time signals. The measured ECAP response patterns exhibited a larger degree of total harmonic distortions than the predicted response patterns.