Download
1 / 16
170 likes | 354 Vues
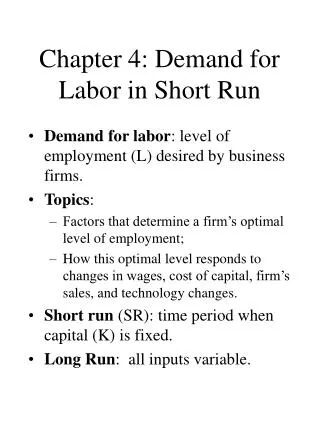
Chapter 3 The Demand for Labor. Profit Maximization. Marginal Benefit Marginal Product (MP) MP = change in Q/change in L Marginal Revenue (MR) = P MB=MP*MR Marginal Expense = wages Optimal Solution: MB=ME. Short Run. K fixed Firm chooses Q Chooses L given K

E N D
Chapter 3 The Demand for Labor
Profit Maximization • Marginal Benefit • Marginal Product (MP) • MP = change in Q/change in L • Marginal Revenue (MR) = P • MB=MP*MR • Marginal Expense = wages • Optimal Solution: MB=ME
Short Run • K fixed • Firm chooses Q • Chooses L given K • Marginal Product of Labor changes
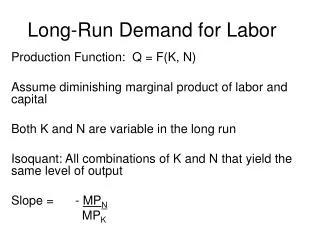
Figure 3.1 Demand for Labor in the Short Run (Real Wage)
Figure 3.2 Demand for Labor in the Short Run (Money Wage)
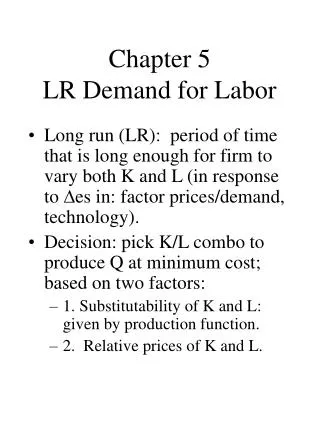
Long Run • K can vary • MRPL = MR*MP = wage • MRPK=MR*MP = cost of capital • If MR=P then P=w/MPL P=c/MPK • W/MPL=C/MPK
If wages rise Equation is no longer equal - cut L, raise K • MPL rises • MPK falls • Cut K • Adjust until optimal again Scale Effect – less of both Substitution Effect – less L, more K
Effect of Increase in the Price of One Input (k) on Demand for Another Input ( j ), Where Inputs Are Substitutes in Production Figure 3.3
The Market Demand Curve and Effects of an Employer-Financed Payroll Tax Figure 3.7
Figure 3.8 Payroll Tax with a Vertical Supply Curve
Figure 3A.1 A Production Function
Figure 3A.2 The Decline Marginal Productivity of Labor
Cost Minimization in the Production of Q* (Wage = $10 per Hour; Price of a Unit of Capital = $20) Figure 3A.3
Cost Minimization in the Production of Q* (Wage = $20 per Hour; Price of a Unit of Capital = $20) Figure 3A.4
Figure 3A.5 The Substitution and Scale Effects of a Wage Increase