Download

1 / 12
120 likes | 252 Vues
Using ArcHydro Tools to Analyze Conservation Priorities. Jonathan Ogren CE 394K Term Project, Fall 2004. Goal and Hypothesis. Goal: Compare the results of systematic conservation planning in Quebec using both grid quadrants and water catchments as evaluation areas.

E N D
Using ArcHydro Tools to Analyze Conservation Priorities Jonathan Ogren CE 394K Term Project, Fall 2004
Goal and Hypothesis Goal: Compare the results of systematic conservation planning in Quebec using both grid quadrants and water catchments as evaluation areas. Hypothesis: As catchment areas are based upon a natural delineation of the landscape, they will more efficiently capture target species in comparison to grid cells of equivalent average size. - evaluate area needed to meet targets, rate of common occurrence within evaluation areas
Introduction to Systematic Conservation Planning • Systematic Conservation grew out of the realization that most conservation efforts were ad hoc (Pressey 1993) • Prioritize areas for conservation based upon rarity through known datasets • Studies generally brake up landscape into workable units such as hexagons or grid quadrants. • Use of GIS tools quickly integrated into process
ResNet • Developed by the Biodiversity and Biocultural Conservation Laboratory here the University of Texas • Conservation software package with an iterative area prioritization algorithm based on rarity and complementarity. • Rarity- species or landscape characteristic with limited range • Complementarity- area added to solution set should be the one with the most currently unrepresented targets. • Set target levels– should all occurrences of a surrogate be included in the solution set or a percentage of the total.
Study Area 3 sites to confirm results Focus on Quebec • Total Area: 1522842 sq km • Elevation Range from: sea level to 1,305m • Latitude Range of 45 to 60 Degrees N • 450 listed rare species
Quebec Data Set Presents/ Absents Species Data • Use of 718 species with 95,150 occurrences • Species at risk database • 346 of the 374 plant species • 48 of the 76 animal species • Supplemental data • small mammals, game mammals, fish, and bird presents data North America Hydro 1k DEM • http://lpdaac.usgs.gov/gtopo30/hydro/namerica.asp
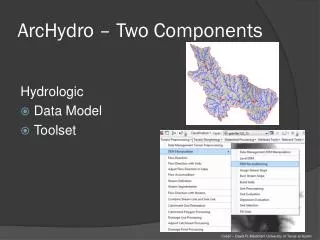
Methods • Obtain surrogate data used in Garson et. al (2002) and Sarakinos et. al (2001) • Build ArcHydro database for Quebec • 21,254 catchment areas as compared to 21, 403 grid cells. • Determine conservation priority areas using ResNet Software Package • Compare results from grid quadrant and catchment area methodologies • area needed to meet target levels • common occurrence of targets in evaluation area • coincidence of land divisions with evaluation area borders
What is Expected Using only surrogates considered rare– all included in the solution set. Results from (Sarkinos 2001) Area needed to meet targets: 1170 cells selected 95, 869 sq km total area 6.3% of Québec Found in currently protected areas: 33.5% plants at risk 41.7% animals at risk
What is expected(cont.) Using only surrogates considered rare– 20 occurrences are included in solution set Area needed to meet targets: 530 cells selected 43,460 sq km total area 2.9% of Québec Results from (Sarkinos 2001)
Implications Weaknesses of process • Results Data Dependent • Time not taken into consideration • Tools not readily accessible for use on large datasets by conservation professionals Strengths • Takes ambiguity out of the process and highlights areas previously overlooked • Allows for a more efficient use of allotted resources • GIS continues to enable improvements in analysis • Use of catchments allows for the landscape to be broken up into areas that encode natural processes
Acknowledgements • Thank to the Biodiversity and Biocultural Conservation Laboratory at UT for sharing data and expertise with special thanks to: Sahotra Sarkar, Ph.D. Trevon Fuller Justin Garson