Download
1 / 3
30 likes | 131 Vues
This is Rocket Science A P roject about Leadership in Science and Mathematics By James Freiheit , Michael Herriage , Sheharyar Khan, Austin Wegner McMurry Center for Mission Outreach with Science and Technology (MCMOST), McMurry University, Abilene, Texas 79697.

E N D
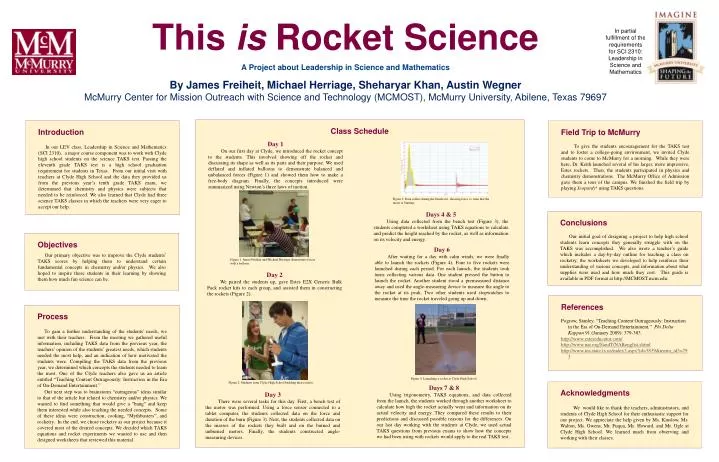
This is Rocket Science AProject about Leadership in Science and Mathematics By James Freiheit, Michael Herriage, Sheharyar Khan, Austin WegnerMcMurry Center for Mission Outreach with Science and Technology (MCMOST), McMurry University, Abilene, Texas 79697 In partial fulfillment of the requirements for SCI 2310: Leadership in Science and Mathematics Class Schedule Introduction In our LEV class, Leadership in Science and Mathematics (SCI 2310), a major course component was to work with Clyde high school students on the science TAKS test. Passing the eleventh grade TAKS test is a high school graduation requirement for students in Texas. From our initial visit with teachers at Clyde High School and the data they provided us from the previous year’s tenth grade TAKS exam, we determined that chemistry and physics were subjects that needed to be reinforced. We also learned that Clyde had three science TAKS classes in which the teachers were very eager to accept our help. Field Trip to McMurry To give the students encouragement for the TAKS test and to foster a college-going environment, we invited Clyde students to come to McMurry for a morning. While they were here, Dr. Keith launched several of his larger, more impressive, Estes rockets. Then, the students participated in physics and chemistry demonstrations. The McMurry Office of Admission gave them a tour of the campus. We finished the field trip by playing Jeopardy! using TAKS questions. Day 1 On our first day at Clyde, we introduced the rocket concept to the students. This involved showing off the rocket and discussing its shape as well as its parts and their purpose. We used deflated and inflated balloons to demonstrate balanced and unbalanced forces (Figure 1) and showed them how to make a free-body diagram. Finally, the concepts introduced were summarized using Newton’s three laws of motion. Figure 3. Data collect during the bench test, showing force vs. time that the motor is burning. Days 4 & 5 Using data collected from the bench test (Figure 3), the students completed a worksheet using TAKS equations to calculate and predict the height reached by the rocket, as well as information on its velocity and energy. Conclusions Our initial goal of designing a project to help high school students learn concepts they generally struggle with on the TAKS was accomplished. We also wrote a teacher’s guide which includes a day-by-day outline for teaching a class on rocketry, the worksheets we developed to help reinforce their understanding of various concepts, and information about what supplies were used and how much they cost. This guide is available in PDF format at http://MCMOST.mcm.edu. Objectives Our primary objective was to improve the Clyde students’ TAKS scores by helping them to understand certain fundamental concepts in chemistry and/or physics. We also hoped to inspire these students in their learning by showing them how much fun science can be. Day 6 After waiting for a day with calm winds, we were finally able to launch the rockets (Figure 4). Four to five rockets were launched during each period. For each launch, the students took turns collecting various data. One student pressed the button to launch the rocket. Another student stood a premeasured distance away and used the angle-measuring device to measure the angle to the rocket at its peak. Two other students used stopwatches to measure the time the rocket traveled going up and down. Figure 1. James Freiheit and Michael Herriage demonstrate forces with a balloon. Day 2 We paired the students up, gave Estes E2X Generic Bulk Pack rocket kits to each group, and assisted them in constructing the rockets (Figure 2). References Pogrow, Stanley. “Teaching Content Outrageously: Instruction in the Era of On-Demand Entertainment.” Phi Delta Kappan 91 (January 2009): 379-383. http://www.esteseducator.com/ http://www.nar.org/SandT/NARenglist.shtml http://www.tea.state.tx.us/index3.aspx?id=3839&menu_id3=793 Process To gain a further understanding of the students’ needs, we met with their teachers. From the meeting we gathered useful information, including TAKS data from the previous year, the teachers’ opinion of the students’ greatest needs, which students needed the most help, and an indication of how motivated the students were. Compiling the TAKS data from the previous year, we determined which concepts the students needed to learn the most. One of the Clyde teachers also gave us an article entitled “Teaching Content Outrageously: Instruction in the Era of On-Demand Entertainment.” Out next step was to brainstorm “outrageous” ideas similar to that of the article but related to chemistry and/or physics. We wanted to find something that would give a “bang” and keep them interested while also teaching the needed concepts. Some of these ideas were construction, cooking, “Mythbusters”, and rocketry. In the end, we chose rocketry as our project because it covered most of the desired concepts. We decided which TAKS equations and rocket experiments we wanted to use and then designed worksheets that reviewed this material. Figure 4. Launching a rocket at Clyde High School. Figure 2. Students from Clyde High School building their rockets. Acknowledgments We would like to thank the teachers, administrators, and students of Clyde High School for their enthusiastic support for our project. We appreciate the help given by Ms. Kinslow, Ms. Walton, Ms. Owens, Mr. Fuqua, Ms. Howard, and Mr. Ogle at Clyde High School. We learned much from observing and working with their classes. Days 7 & 8 Using trigonometry, TAKS equations, and data collected from the launch, the students worked through another worksheet to calculate how high the rocket actually went and information on its actual velocity and energy. They compared these results to their predictions and discussed possible reasons for the differences. On our last day working with the students at Clyde, we used actual TAKS questions from previous exams to show how the concepts we had been using with rockets would apply to the real TAKS test. Day 3 There were several tasks for this day. First, a bench test of the motor was performed. Using a force sensor connected to a tablet computer, the students collected data on the force and duration of the burn (Figure 3). Next, the students collected data on the masses of the rockets they built and on the burned and unburned motors. Finally, the students constructed angle-measuring devices.
L4 60° L3 L1 L2 60° L5 • Lasers • Laser light is different from normal light because it is coherent, which means that the light is emitted in a narrow beam. Using lasers to accelerate the spacecraft has several advantages over using the sun’s light. First, the distance between the Earth and the craft is smaller than the distance between the craft and the sun. Second, the laser can be focused on and aimed toward the craft. • LagrangianPoints • The force of gravity between two objects depends on the mass of the two objects, and the square of the distance between them. In any system of three bodies, you will always be able to find exactly five places where the force of gravity of two of the objects acting on a third object balance in such a way that they corotate. These five points are called Lagrangian points. At these locations, the third object will be able to remain stationary relative to the other two Today, the weight of a space shuttle at launch is approximately 95 percent fuel. What could we accomplish if we could reduce our need for so much fuel and the tanks that hold it? For a planet and sun, three of the points, L1, L2, and L3 lie in a line along the planet and sun. These points act more as saddle points, so an object could move out to the side. The other two points, L4 and L5 lie 60° ahead and behind the planet. These two points are much larger the first three points, as well as more stable because they are more like wells. At the Earth’s orbit, the radiation pressure of the sun is 4.6 μP. For the failed Cosmos 1 solar sail, this would have caused an acceleration of 0.0005 m/s2. After 1 day, it would reach 45 m/s (100 mph), and after 3 years, it would reach 45,000 m/s (100,000 mph). At this speed it could have reached Pluto in 5 years. A laser could produce a pressure 100 times greater. Imagine how much faster it could have gone if it used lasers instead! The sun can only be used for acceleration. If lasers were placed in the farther reaches of the solar system, they could be used for braking as well as for acceleration. Put It All Together An Idea? What we propose is that if we could combine the solar sail concepts, laser light source, and Lagrangian points we can plan one of the most efficient methods of space travel. Concept To go to a higher orbit (travel farther away from the object), you angle the solar sail with respect to the laser so that the pressure generated by photons is in the direction of your orbital motion. The force accelerates the spacecraft, increases the speed of its orbit and the spacecraft moves into a higher orbit. In contrast, if you want to go to a lower orbit (closer to the object), you angle the sail with respect to the laser so that the pressure generated by the photons is opposite the direction of your orbital motion. The force then decelerates the spacecraft, decreases the speed of its orbit and the spacecraft drops into a lower orbit. • Solar Sails • A solar sail-powered spacecraft does not need traditional propellant for power, because its propellant is sunlight and the sun is its engine. • How does it work? • The reflective nature of the sails is key. As photons (light particles) bounce off the reflective material, they gently push the sail along by transferring momentum to the sail. Because there are so many photons from sunlight, and because they are constantly hitting the sail, there is a constant pressure (force per unit area) exerted on the sail that produces a constant acceleration of the spacecraft. • Equations • Where F=Force (in N), P=Power (in W), A=Surface Area (in m2), • c = Speed of Light (in m/s), a=Acceleration (in m/s2), • and m=Mass of Object (in kg) • What is needed to make a Solar Sail • Two main components: • Continuous force exerted by light source • A separate launch vehicle • A second spacecraft is needed to launch the solar sail, • which would then be deployed in space. Laser Sails The Mission Taking solar sail spacecrafts with lasers attached we can send the lasers out into larger orbits and place them in the 4th and 5th Lagrangian points of the planets in the solar system. These Lagrangian points will essentially become orbital checkpoints for our space travel mission. The figure above shows a (not to scale) idea of where the lasers would be placed in Lagrangian points 4 and 5 of the planets. The red dots on the orbits represent the lasers. Once these lasers are in place throughout our solar system we could possibly send a large solar sail spacecraft into space and have it accelerated through the checkpoints into the depths of our solar system. Austin Wegner Todd Neer McMurry University • Picture Sources • http://www.gcsescience.com/pun3.htm • http://science.howstuffworks.com/solarsail2.htm • http://en.wikipedia.org/wiki/Solar_sails • http://en.wikipedia.org/wiki/Lasers
May Term 2008 Astronomy Trip Results Michael Herriage, Jeanette Schofield, & Aaron WardDepartment of Physics, McMurry University, Abilene, Texas 79697 Introduction In May of 2008, Dr. Keith and three McMurry students travelled to Flagstaff, Arizona to observe the stars for a week on the National Undergraduate Research Observatory’s (NURO) 31" Telescope. We spent our nights at the observatory taking data and went sightseeing during the day. For four of the five nights we were there, we used the telescope to take images of the night sky (on the fifth night, it snowed and we were unable to collect any data). These images were used for two different purposes: blinking and stacking. Astraea Astraea is an asteroid in the main asteroid belt. The asteroid was first discovered in 1845 by Karl Ludwig Hencke. We observed Astraea because its well-known location allowed us to easily practice locating a moving object. The image on the right was taken approximately three hours after the image on the left. By blinking the images back and forth quickly, we were able to locate the asteroid. In the images below, Astraea is the bright dot inside the blue squares. It can easily be seen that Astraea's location relative to the background stars changed in just a few hours. Right Ascension: 12:50:03 / Declination: 12:48:20 Saturn Saturn is the sixth planet from the Sun and is classified as a gas giant. One of Saturn's most distinctive features are its rings which are composed of many small particles orbiting the planet. We took images of Saturn to get practice in stacking images. Normally, images taken of Saturn are sharper and do not have a yellow tint. The reason why are images are so fuzzy is due to the combination of a cloud cover the night the images were taken and the fact that we should have taken more images of the planet. Right Ascension: 10:17:52 / Declination: 12:28:16 Pluto Pluto was discovered in 1930 by Clyde Tombaugh at Lowell Observatory. While on the trip, we stopped by Lowell Observatory and were able to see the actual device that Tombaugh used to discover Pluto. The device, which is called a blink comparator, is shown below. Seeing where Pluto was discovered inspired us to also find Pluto ourselves. To do this, we had to take images of it over a couple of nights. The reason for this is that Pluto is moving much slower than an asteroid so we had to allow enough time to pass for Pluto to move in relation to the background stars. Pluto is the bright dot inside the small square below. Right Ascension: 12:55:04 / Declination: -5:53:24 Blinking Blinking is a technique often used in astronomy to locate a moving target. When two images are blinked together, they are overlapped and then flashed back and forth quickly. Stars are very far away from Earth so they will not move in the images. However, objects that are much closer (such as an asteroid in the asteroid belt) will be able to be identified moving in the images. Since there is a lot of noise captured in images taken of the night sky, it is best to take images of the target object at a couple different periods of time. In years past, locating a moving object using blinking techniques was time intensive. An astronomer would have to manually move the telescope into position before taking a picture of the night sky. Due to the Earth’s rotation about its axis every 24 hours, the telescope had to be readjusted often in order to keep track of the same group of stars. After all of the images had been acquired, the astronomer would use a device called a blink comparator to locate any moving objects. Despite the fact that blinking was very time intensive, it was used to discover various asteroids and comets as well as Pluto. Today, computers have made the process of finding a moving target much faster. At the observatory, movement of the telescope was controlled via computer and a camera was mounted onto the telescope. Thus, by just inputting coordinates for the desired area of study, the telescope would automatically be moved to that location. We then took images of the area using the NASACAM’s programmable adjustments, controlling exposure time, number of exposures, and filter types. A few hours later (or, in the case of planets, a few nights later) we once again took pictures of the same area. Once we had collected enough data, we used Project CLEA's (Contemporary Laboratory Experiences in Astronomy) Astrometry of Asteroids software program to blink them. To find the desired target, we uploaded two different images of the same location, each taken at a different time. CLEA automatically aligned the stars so that the images would line up. After the stars were aligned, CLEA blinked the images together. During the trip, we started out by observing the well-known targets of Astraea and Pluto. Then, we moved the camera to three random locations in the hope of finding a new asteroid or comet. Searching for a New Discovery Asteroids and comets are found by astronomers looking at unknown areas of the sky and trying to see if they can find a new, undiscovered object. We took images of three random areas of the sky in hopes of finding a new asteroid of object. Unfortunately, we did not find anything new. The images below are the three different areas that we looked at. Right Ascension: 12:55:04 / Declination: -5:53:24 Right Ascension: 12:55:04 / Declination: -4:53:24 Right Ascension: 12:55:04 / Declination: -3:53:24 What to do When it Snows… To be able to observe the sky, the weather conditions need to be just right. Rain or snow could damage the observatory’s telescope. In addition, cloud cover caused images taken of the night sky to be fuzzy. Thankfully, the weather cooperated for most of the week and we were able to gather a lot of data. However, on the last night of observations, it snowed. Of course, we weren’t too upset… Stacking Stacking is a technique often used in astronomy to improve the clarity of a celestial object in an image. When an astronomical image is taken, there is a lot of noise. By taking many images of the same object and combining them, the noise in the images can be reduced and a clearer picture of the desired object can be obtained. The more images that can be taken of the desired object, the clearer the final image will be. To use stacking, we took multiple images, one after another, with the same intensities for each image. We then uploaded each image into an imaging software program where each image was treated as a layer. Once all the images were uploaded, we used Registax4 to “stack” the images on top of each other, creating a single image. This newly-created image showed the desired object with most of the background noise removed. In addition to noise reduction, stacking can also be used to create colored images. The telescope had five different lens settings: a red, green, or blue filter, an ultraviolet filter, and no filter. By combining images taken in the red, green, and blue filters, we were able to create colored images. We dubbed these colored images "pretty pictures." Acknowledgments Thank you to Dr. Keith for putting up with us for a whole week and showing us how cool observational astronomy can be. The background picture is from http://www.cgtextures.com/. Questions or Comments? Please contact Michael at herriage.michael@students.mcm.edu, Jeanette at schofield.jeanette@students.mcm.edu, or Aaron ward.aaron@students.mcm.edu. An online version of this poster can be found at cs1.mcm.edu/~schofield.jeanette/physics/ssp/mayTerm.ppt