Download
1 / 22
220 likes | 318 Vues
Save money. Live better. January 11, 2012. Measurable Improvements. Florida Health Care Affordability Summit 2012. Lowering The Cost Of Health Care. To lower the total cost of health care (i.e. impact overall trend), two things:

E N D
Save money. Live better. January 11, 2012 Measurable Improvements Florida Health Care Affordability Summit 2012
Lowering The Cost Of Health Care • To lower the total cost of health care (i.e. impact overall trend), two things: • Recognize that not all health care providers are the same – choose the “right” ones. • Drive more utilization of the right kind of services at the right time, place and price.
Bad Health Care “Results” Driven By Design Of The Market Care is not affordable, convenient or consumer friendly Costs are too high … …care cannot be accessed conveniently… … and does not meet consumer expectations. Percentage of consumers who have deferred care in the past year (2011) because of cost Nearly 60M Americans live in Primary Care Health Professional Shortage Areas 2012 Forrester Customer Experience Index Score 87 81 69 66 55 38 In 2011, the average annual premium for employer-sponsored health insurance was $15,073 for family coverage — up 9% from 2010 and 113% from 20011 Current gap of over 16,000 practitioners Healthplans scored 26 points lower than retailers on average Sources: 1 PwC Health Research Institute 2 US Department of Health and Human Services 3 Forrester Customer Experience Index
The Pharmacy Perception – “Customers’ View” “Honey, it doesn’t matter. They are all the same price.” Haymarket Square Farmers’ Market Boston, MA
Here’s The Pharmacy Reality – “Payers’ View” Comparing Walmart Prescription Reimbursement vs. Competitive Channel in an Open Network • When participating in a Preferred Network, Walmart may provide even greater discounts, increasing the spread by an additional 500-1000 bps. Source: Multiple Large PBM Open Network Reimbursement analysis 2012
“Preferred Pharmacy Networks” Drive Significant Savings (13%-18%) Source: Milliman HR Consulting and Restat
Not All Pharmacies Are The Same: Differences In True Quality Example of Differences in Pharmacy Performance in Driving Better Health Outcomes: Medication Adherence
Not All Pharmacies Are The Same: Differences In True Quality Notes: EQUIPP Analysis for Large Medicare Plan on ability of pharmacy to ensure patient on diabetes Rx is also on a hypertension Rx
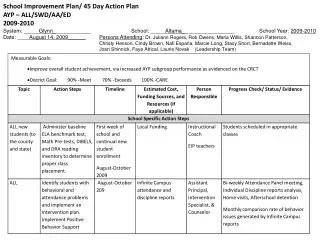
Employers In Ohio: Distribution Of Normal Deliveries Across Providers Notes: Analysis of normal vaginal deliveries across the State of Ohio (same CPT code) for set of employers representing 3 million lives in 2011
Employers In Ohio: Cost Per Normal Deliveries Across Those Providers Notes: Analysis of normal vaginal deliveries across the State of Ohio (same CPT code) for set of employers representing 3 million lives in 2011
Aggregated Employer Cost For Various Procedures Notes: Analysis by Analytica and Employer Health Care Direct (EDHC) 2012
Is The Problem Overutilization Or Underutilization? Cholesterol Testing 130 Million 13 Million
Underutilization Is Driving Gaps In Care Drivers of underutilization Key gaps in care Costs Too High Only 62% of recommended routine labs arebeing completed • Only 13% of the recommended visits for hypertensive patients are being utilized Too Hard to Access Lack of Awareness of Available Care Lack of / Gaps in Health Insurance Coverage • Only 10% of the 60+ population get a shingles vaccination • <1% of new enrollees completed their Welcome to Medicare Exam Not Focused on Customer Experience Sources: RAND (2011), American Medical News, American Medical Association (2011), CDC (2012), CMS (2011), PBS, NPR, Robert Wood Johnson Foundation: Health and Health Care Improvement, Boston Globe, Sun Sentinel
The Risk Of Underutilization: How Will You Know Who Will Explode? Reduction in risk equals lower cost Behavioral Risk Per Member Clinical Risk Per Member *This is medical spend only. If you calculate total productivity the 7.76x becomes more like 13-16x * Statistics based on SHPS profile of 25M members
More Utilization At The Right Place/Time/Price Can Lower Costs • The current health services market is 44% lower than if all clinical recommendations were followed • Healthcare reform will add to the problem with up to 30 million new consumers • Basic health services includes: • 50-65% of primary care (chronic and basic acute) • Health screenings (Welcome to Medicare, Annual Wellness Visit, biometric screens) • Routine labs • Immunizations (excluding pediatrics) • While this increase in basic care utilization would result in over $145 Billion more in spend for those services, it would actually reduce overall spend by 2-3x because of the impact of having a more informed, engaged healthcare consumer. Retail Health Service Market for Basic Care Potential 1,325 Million visits/year Current 750 Million visits /year Size of Prize = $185 Billion 44% lower Size of Prize = $330 Billion Notes: PWC Health Care Analysis 2012
Quality Is Not An Issue In Clinical Care Delivered At Retail Major gaps in care utilization can be solved with an expanded retail model- at a lower cost and at equal or better quality Cost and Quality of Care Sources: Angie’s List, “Sizing up retail clinics: Quality and Cost,” (2011)
To Win The “War”, We Have To Get In The Fight! The retail setting (150 Million Customers/Week) + the discounters’ mindset (Every Day Low Price- EDLP) can be the answer to driving “engagement”. Current Status PCP Lab PCP Pharmacy Approximate time: 3-5 weeks (+ 4 hours travel) Primary Care Visit ($133) Lab Test at Draw Site ($50) Primary Care Visit ($133) Pharmacy Script Fill ($10) 4 visits Total Cost: $326 Walmart Model Health Screening ($45) Approximate time: 30-90 min. (+20 min. travel) 1 visit Primary Care Visit ($60) Pharmacy Script Fill ($4) Lab Test ($22) Total Cost: $131
SCIENTIFIC DISCOVERY 1945 1950 1955 1960 1965 1970 1975 1980 1985 1990 1995 First clinical Cardio - First Penicillin First renal Microsurgical CT use of Recombinant Laparoscopic pulmonary successful MRI available transplant techniques scanners monoclonal drugs ( tPA ) surgery bypass liver tx . antibodies First kidney Crick & Watson Monoclonal Radio - First heart Fetal dialysis crack genetic antibody immuno - Cyclosporin Angioplasty EPO transplant surgery machine code technology assay HEALTHCARE CHANGES National Division of Immigration Medicare CON , HSA IRS code : health Growth of Medicare HMO Managed Health Research laws renal Health DRGs RBRVS benefits tax free " The Blues " Medicaid Act Competition ? Service ( UK ) Grants changed dialysis Planning HEALTHCARE EXPENDITURES (% of GDP) 5 . 3 % 5 . 5 % 7 . 5 % 9 . 4 % 12 . 2 % > 14 % HEALTHCARE MANPOWER (MDs/100,000 population) 1 . 42 2 . 44 “Medical Progress” & The Myth Of Not Enough “Supply” 21st Century 2010 VADs, ICDs Genomic Medicine Health Reform > 18% 2.56 PCP:SPECIALIST RATIO 1:3 2:1 1:2 Source: Alere Health Analysis, Department of Labor Analysis, HHS Analysis
Lowering The Cost Of Health Care • To lower the total cost of health care (i.e. impact overall trend), two things: • Recognize that not all health care providers are the same – choose the “right” ones. • Drive more utilization of the right kind of health services. Leverage the low-cost, strong outcomes providers and figure out how to drive all your Plan’s utilization to those providers. Motivate your employees/members in any way possible to do a health “baseline” and then motivate them to “engage”.