Download
1 / 56
560 likes | 747 Vues
PSY6009: Statistics, Psychometrics and Research Design. Professor Leora Lawton Fall 2007 Mondays 4-7 PM Room 204 Updated August 2007. © 2006, 2007 Leora E. Lawton. Introduction. Give the syllabus a careful read.

E N D
PSY6009: Statistics, Psychometrics and Research Design Professor Leora Lawton Fall 2007 Mondays 4-7 PM Room 204 Updated August 2007 © 2006, 2007 Leora E. Lawton
Introduction • Give the syllabus a careful read. • Attendance and completion of assignments is mandatory. No assignment will be accepted that is more than 2 weeks late. • No excuses except death in the family or serious illness. May everyone and your families be blessed with health. • You will need to select a data set early on for the assignments. See the website, www.techsociety.com/alliant Psy6009 – Fall 2007 Leora Lawton, Ph.D.
Defining the Objective • Before you know what to research you must first figure out what you want to know. Example • Problem: Acme Manufacturing Company needs to upgrade its purchasing software and system because the old one doesn’t fit the new standards, and it’s costing them time and money, plus frustrated staff and suppliers. • Research Objective: How can we best train our staff on the new system? Psy6009 – Fall 2007 Leora Lawton, Ph.D.
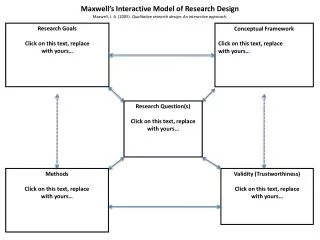
Identify the Relationship: I • The conceptual model and framework is developed in your dissertation proposal. • A conceptual model consists of the relationship between that which you seek to explain (which will be the dependent variable(s)) and the explanatory factors (independent variables). The relationship is explained by the theory. Psy6009 – Fall 2007 Leora Lawton, Ph.D.
Identify the Relationship: II • Example: Effectiveness training occurs when participants when there is maximal support, and minimal intrusiveness and burden. Social Psychological Theories for Developing Competence Psy6009 – Fall 2007 Leora Lawton, Ph.D.
Operationalizing Your Model I Here is the process for operationalization, which means to: • Develop hypotheses • Select or develop the variables to test them The process: • For each concept, state the effect and the direction. • For each concept, and using your data set, identify specific variables that would stand in to measure (operationalize) your concept. Don’t for forget the dependent variable (outcome concept)! • Then, for each of these variables, now state the direction of the effect on the dependent variable as a hypothesis. Psy6009 – Fall 2007 Leora Lawton, Ph.D.
HW: Operationalizing your model • Operationalizing your models: add this to your developing proposal. • Example: • We are explaining employee satisfaction. Our overall conceptual model posits that satisfaction = f{salary, manager relationships, job quality} • We are using data from the empsat.sav file, a 10% subset of a data set consisting of over 15000 respondents from 182 companies, who were interviewed using an internet survey in June 2007. In some cases, there are an insufficient number of cases per company for statistical reliability, but the richness of cross-company comparisons and size of the sample makes it possible to reach tentative conclusions to be further validated in subsequent research. • Employee satisfaction is operationalized using the 10-point overall satisfaction measure, “Overall, how satisfied are you on your job” where 1 = Not at all satisfied and 10 = Completely satisfied. • Salary is measured by ‘How satisfied are you with your total compensation (salary, benefits, bonuses)? Which is measured on an anchored 7-point scale, where 1 = Not at all satisfied and 7 = very satisfied. Management is measured by a 5-point scale of “I respect my immediate manager” and for senior management, “The senior management team offers leadership I can trust”. For both these measures, 1 = Strongly disagree and 5 = strongly agree. Job quality is measured by I’m challenged and interested in my work” which is also measured on the same 5-point scale. For all four independent variables, we expect a positive relationship with the dependent variable. • In addition, we add a control variable for race, whether one is black or non-black (where 1= black, and 0 = non-black). We expect that, due to problems of racism in the workplace, blacks are likely to give a lower rating of job satisfaction than non-blacks. Psy6009 – Fall 2007 Leora Lawton, Ph.D.
Operationalizing Your Model II For the overall model: • Effective training results when: • Employees are given adequate support from the company (maximal support) • Training is given appropriately (minimal burden) Go to the website, and click on the employee dataset link there (not the same one as the homeworks) • For Minimal Burden, we only have “I receive the training I need for my job” • For Maximal Support we have “My company sends me to professional conferences” and “My company provides me opportunities for continuing education” • For the dependent variable (training effectiveness) we are also limited, so we can say, “My immediate manager recognizes and acknowledges my contributions” • How valid are these?? • Hypotheses: • The more respondents agree that they receive the training they need the more likely they are to agree that their manager recognizes and acknowledges their contributions. • The more respondents agree that they get sent to conferences, and that they have opportunities for continuing ed, the more they will agree that their manager recognizes their contributions. Control Psy6009 – Fall 2007 Leora Lawton, Ph.D.
Control Variables • In addition to the variables in your model that are there to test your hypotheses directly, you also need to put these relationships in a context…what could affect the dependent variable beyond these measures? These are control variables. • Controls are typically characteristics of the respondents, such as demographic data. • In our example, the control(s) might be years employed here, age, gender or race. Psy6009 – Fall 2007 Leora Lawton, Ph.D.
From Objective to Design • Once the objective is clearly identified, then you can begin thinking about • Sample – • Who can provide you this data, • Who is involved in the process or phenomenon, • Do you need a control or comparison group? • Design • Experimental • Cross-sectional • Panel • Longitudinal Psy6009 – Fall 2007 Leora Lawton, Ph.D.
From Objectives to Design • Experimental: Refer to Shadish, Cook and Campell if using an experimental design • Comparing groups (control vs test) • Randomly assigned • Not randomly assigned • Self-controls – before after designs or panel (same respondents • Historical – comparing results from one sample with a later one (different respondents) • Combination – factorial (see Fink, pg 49). Psy6009 – Fall 2007 Leora Lawton, Ph.D.
From Objectives to Design • Descriptive • Cross sectional (snapshot) • Cohorts – same people over time, or same sample frame over time (longitudinal in my book) • Case control - matching Psy6009 – Fall 2007 Leora Lawton, Ph.D.
Where We’re Heading With All This • Ultimately, the goal is to produce a solid piece of research, be it for academic, policy, business or non-profit management audiences. • All work should therefore be appropriate for the audience, and yet all work has certain elements in common Psy6009 – Fall 2007 Leora Lawton, Ph.D.
Writing Criteria • Organization • Follows research writing outline • Logical flow of presentation • Topics where they belong • Clarity • Ideas, arguments and explanations spelled out. • Succinct, concise, non-overly verbose • Simple sentence structure where appropriate (read: everywhere possible) • Accurate • Grammatically correct, no spelling errors, language current • Acronyms spelled out, citations for quotes, references • APA Style (or appropriate) Psy6009 – Fall 2007 Leora Lawton, Ph.D.
Organization • Introduction of Question • What is happening that is prompting the research • Why it’s important • Topics where they belong • Literature Review • Background for the general topic • Theoretical pieces to build your explanation around • Based on the literature, what is the gap in our knowledge, and how are you proposing to explain it, that is, what are your hypotheses for your particular research question • Provide a model, that is, a diagram AND the verbal explanation for it. • State your hypotheses • Methods Section • Explain your data source or data set (sample, number of respondents, how collected, when, who collected it) • Describe strengths/weaknesses of your data set. • Describe your dependent variable and then your independent variables, starting with your most important Psy6009 – Fall 2007 Leora Lawton, Ph.D.
Where We’re Going • We are going to learn how to design proper research to reach objectives. • Causal research …. What causes, predicts, or is associated with some behavior or outcome • Descriptive …. An assessment or characterization of a population. • Empirical study • Collect data, or analyze existing data bases • Test hypotheses or use statistics to describe • Proper research design to accomplish objectives • Identification of correct population for tests of hypotheses or description • Measurement critical • Describe methods – data source, sample, measurements, • Results of statistical analysis (next semester) • Write up results and then interpret results (next semester) Psy6009 – Fall 2007 Leora Lawton, Ph.D.
Design Issues • Purpose of research • Behavioral modeling • Program evaluations • Needs assessment • Design types • Cross-sectional • Experimental • Longitudinal • Panel • Things to consider in design • Correct sample • Causality versus association • Measurement • Threats to validity Psy6009 – Fall 2007 Leora Lawton, Ph.D.
Homework Example • HW 2: Start conceptual model: Identify the concept to be explained, define it. Then state the concepts that are causally related to or associated with this concept. Create the model (see slide #5) in PowerPoint, and paste the picture into your essay. • Also, start thinking about what kind of research design would make most sense for your study, and be prepared to discuss it in class. • Using our example: Training effectiveness is an important feature for developing capability in an organization. Based on our literature review, the model below presents the factors we need to consider in order to develop and test an effective training program. First, effectiveness is defined as the development of competence, that is, a measurable improvement in skill level or, for completely new capability, demonstrated competency. Second, effectiveness is more likely to occur when there is both support from the organization, and minimal burden on the part of the trainee. Because people tend to learn in small steps with positive reinforcement (cite social psych theorists here) we see that minimal burden is an appropriate number of training sessions for the complexity of the material, high quality instructors, and supporting material. Maximal support includes coordination between management and supervisors, time off from work to do this, or additional compensation should training occur outside of regular work hours, as well as support for additional time needed to complete other ongoing responsibilities. Psy6009 – Fall 2007 Leora Lawton, Ph.D.
Research Designs • Cross-sectional • A ‘snapshot’ of what’s happening right now. Used to explore associations. Some causal relationships are possible with retrospective data (e.g., have you ever been fired). A behavioral model used to understand what factors are associated with certain behaviors, attitudes, opinions or statuses. • Longitudinal studies • The same survey issued at different time periods, e.g., annually, every 5 years, or irregularly. Not issued to the same persons. • Panel studies • In academic research, panel studies refer to the same respondents interviewed at time 1 and then at 1 or more subsequent time periods, generally the same study, with some modifications. • In marketing research, panel studies are made up of people who have agreed to be respondents for any one of a number of research studies. • Omnibus • Cross-sectional studies that allow multiple sponsors to participate in the survey design. Psy6009 – Fall 2007 Leora Lawton, Ph.D.
Research Designs • Experimental and Quasi-Experimental: • True experimental means two groups are randomly selected from a homogeneous population, one group gets a treatment or intervention, the other doesn’t. Measurements are taken before and after the treatment in both groups. (Subsequent measures can detect long-term versus temporary effects.) O – – O – O O – X – O – O • Quasi-experimental designs mean that one or more aspects of the experimental design cannot be upheld. • No control (e.g., evaluating a class) O – X – O • Non-randomized (typical in program evaluation) O1 – - – O1 O2 – X – O2 • Measure 1 group at first interval, and second group at second (education studies or others where excluding one from treatment or intervention is unfair or otherwise problematic). O – – O – X – O O – X – O – – O • There are a number of other possibilities. Again, if this is a research design you wish to explore, read Shadich, Cook & Campbell. Psy6009 – Fall 2007 Leora Lawton, Ph.D.
Homework Example: HW 3 • HW 3: Refine conceptual model. Now that it’s been discussed a bit, how can you make it clearer? Your chosen data set will be part of the reason why you will revisit: how reliable or valid are the variables in your data set for your concepts? Justify this by explaining why they meet these important criteria. • Select the design and justify it (explain why it’s the right one for the research objective). What are the issues of validity & reliability for your design. Do read your text for help. • Example (refer back to slide 19) Because we want to show the impact of a training program, we need to have a pre-test/post-test experimental design. In this design, we will select two groups randomly from the pool of eligible employees. At time 1 we will measure both groups on their skill level. Group A will take the training, and Group B will not. At time 2 we will again measure the skill levels of both groups. In that way we can tell if the differences in the measures – both for comparing the two groups and for comparing the two time periods – can be attributed to the training. We are able to have two randomly selected groups. However, there cannot be a ‘blind’ or ‘double-blind’ control group, so the cognizance of this design may have an impact on the validity. An additional control/test group would make the results more believable because trainer may not be effective. Psy6009 – Fall 2007 Leora Lawton, Ph.D.
Reliability and Validity, continued Constructs are measures that address a certain conceptual idea. • Constructs and their validity: • Content • Face • Convergent • Discriminant • Criterion • Concurrent • Threats • Bad explication (wording) • Doesn’t cover adequate facets • Covers wrong items Psy6009 – Fall 2007 Leora Lawton, Ph.D.
Reliability and Validity Reliability and Validity are important criteria for high quality research, because these criteria are components of being able to generalize and reach solid conclusions. • Reliability – Meaning that using this measure will be able to measure accurately the metric in question. A scale that gives someone a 115 weight one try and a 118 another and a 114 a third is not reliable. • Validity – Meaning that the measure actually measures what it is supposed to measure. For example, a test that measures employee aptitude actually measures aptitude to perform the job, rather than knowledge of the dominant culture. • 6 Kinds of Reliability • Test-retest: same respondents, two points in time where the distance itself should not contribute to any changes. The two should be highly correlated. • Alternate form: Different forms of the same question (How old are you versus: what year were you born?). • Altering one form, for example, reversing scale, changing scale, altering text of question. • Internal: Multiple items for same concept • Cronbach’s alpha examines the variance and means of the items to see how well they ‘hang together’ correlate). • Inter-observer (aka interviewer effects) where different observers should reach the same conclusions. • Cross Cultural Issues • Taboos and sensitivities about question topics, meanings of terms and concepts, norms ‘translations versus normalizations, • There are many other issues to consider, such as age development, roles, etc. *Optional reading: Shadish et al (2002), chapters 2-3. Psy6009 – Fall 2007 Leora Lawton, Ph.D.
Reliability and Validity, continued External validity (that is, generalizability): Narrow to broad; broad to narrow, same level – or similar, to random sample Threats to external validity: Context dependent Selectivity Interaction with causal relationship (even the rats were white males) Threats to the statistical conclusions • Low statistical power • Violated statistics assumptions • Fishing and error rates • Lack of reliability to measurements or design (e.g., treatments, variability in treatments) • Variable range restriction • Heterogeneity of units in outcome variability • Wrong statistical method • Wrong sample population Psy6009 – Fall 2007 Leora Lawton, Ph.D.
About Variables • Kinds of Measurements • Nominal (name) or categorical (of 2 or more categories) • Yes/no, race, political party, job category. • Ordinal (ordered) (strongly disagree to strongly agree): You can’t say that a value of ‘4’ is twice as big as ‘2’, only that it’s bigger than two. • Anchored versus unanchored • Their role in Likert Scales: a set of metrics for describing a concept with high correlation for each component of the construct. • Other variants are Thurstone and Guttman scales. • Ratio (metric with lowest/highest and numbers in between). Here you can say that 4 is twice as big as 2. True ‘zero’ value. • Interval variables: Ordered but can’t say that a value has a specific relationship to another value, although it’s much less arbitrary than ordinal variables (e.g., temperature) • Other terms of record: Discrete (specific values) versus continuous (divisible). Psy6009 – Fall 2007 Leora Lawton, Ph.D.
SPSS • Frequencies – Analyze – Frequencies • Click on desired variables, and then click on arrow to move to Variable(s) window. • Click on Statistics. Select Mean. Select Continue. FREQUENCIES VARIABLES=age /STATISTICS=MEAN /ORDER= ANALYSIS . • Another way to get Means • Analyze – Descriptives – Click on variable, and then click on arrow to move to Variable(s) window. • Click on Options, and click Mean. Click Continue. Click OK. DESCRIPTIVES VARIABLES=age /STATISTICS=MEAN STDDEV MIN MAX . Psy6009 – Fall 2007 Leora Lawton, Ph.D.
Samples and Sampling • Samples – often lists purchased or rented. Association members, employees in a firm, RDD (random digit dialing), listed sample, addresses by zipcode, etc. • Sampling Issues • The Actual Respondents • Universe: The kind of respondents appropriate for this study • Target sample: The actual definition of who qualifies • Sample frame: The list of potential respondents • Sample: More or less the same as sample frame, that is, these are the people you will put in the queue for potential contact. Refers more generally also to the ability to obtain respondents. • Sample Size • How many respondents you need after the data are collected to give you the robust (reliable) statistical results desired. • Sampling strategies • Probability: where all units in the target sample have a non-zero probability of being contacted • Convenience: Non-probability: where some of the target sample units have a zero probability of being sampled. • Snow-ball: Contacting people through contacts Psy6009 – Fall 2007 Leora Lawton, Ph.D.
About Data Do review pp.15-16 periodically Data: Primary and Secondary • Quantitative • Surveys (opinion & status) • Registration data • Measurements of functioning (‘eye movements’ in human factors research) • Data source considerations • Primary: collected by a researcher for that Research need. • As good as the designer makes it. • Can you actually collect the data if you want to collect your own (cost, time, feasibility) • Who can answer your questions (universe) • Where can they be found (sample source) • How do you reach them (phone, mail, internet, face-to-face) • Will these data be robust enough to provide valid results (sample size, measurements) • (to be continued) • Secondary Considerations: Collected by someone else but adaptable to others’ needs. • More efficient in time and money • Not always available or relevant • Variables not good proxies for operationalized concepts • Scope of original study constrains current study • Methodology not in your control. Psy6009 – Fall 2007 Leora Lawton, Ph.D.
SPSS • Uploading data from excel into spss: • File – Open – Data • Find file of data in the correct director/folder • Use All Files for Files of Type • Read variable names from first row if they are in fact there (they are) • Click on Okay. • Then go in and add variable and value labels. Or, run the syntax file that puts them there for you. Psy6009 – Fall 2007 Leora Lawton, Ph.D.
Class Notes • Use this week to work on your literature review for your proposal, and to revise your proposal. Even 2-3 hours in the library can be very productive. Psy6009 – Fall 2007 Leora Lawton, Ph.D.
Sampling I • The goal of your sample is to provide the best possible least biased estimator for your population’s true characteristics (aka: the population parameter µ). • To understand the salience of the sample, let’s review the heads/tails coin toss scene. • If you toss a fair coin 20 times you should get 10 tails and 10 heads, but as you know, you might not. • If you toss a fair coin 2500 times you will get something like 2500 tails and 2500 heads. Here are some possible outcomes: • 2499 tails and 2501 heads • 2300 tails and 2700 heads • 1000 tails and 4000 heads • For which outcome are you more likely to think the coin is fair? • Conclusion: You want a sample that unbiased such that the probability is small that your result is by chance. In other words “the probability that 2499 tails resulted from chance (i.e., not because the coin is fair, but just because) has a probability less than .0001 or, stated another way, if you got 2499 tails, there’s only a .0001 probability the coin is not fair. Psy6009 – Fall 2007 Leora Lawton, Ph.D.
Sampling II • How about errors per sample … suppose you are doing quality testing and you want to know if your sample of your product (or prescriptions in a health care org) are within an acceptable range. • You want the correct number per sample (# correct/#prescriptions filled) to be as close to 1 as possible. Here’s where standard deviations come in. • Standard deviation is the measurement for the distance from the mean as represented in probabilities of the estimate being what it is. • So one sigma SD away means that 67% are within the results. • ‘6 sigma’ is a manufacturing quality standard. • Conclusion: As sample size increases, the SD decreases and _ the greater the likelihood that X will be close to µ. Psy6009 – Fall 2007 Leora Lawton, Ph.D.
More on Sampling Sample size – how much is enough? • Once you know the research design, then how many respondents/units of analysis you need is the question. • Part of this is determined by the analysis you will need to conduct. Experimental design can be conducted successfully on a relatively small number of cases, e.g., 30 each for control and test. An analysis where you will want to conduct a multivariate analysis will require 300 or more. • http://www.surveysystem.com/sscalc.htm • How many do you need? What’s your tolerable error? Psy6009 – Fall 2007 Leora Lawton, Ph.D.
More on Sampling • We use Students T and F (chi-square) to decide whether the sample mean X is close enough to the µ because the probability of µ is a normal distribution. • We know this because of the Central Limit Theorem, which says that the sampling distribution about the true mean approaches a normal distribution. • Thus: the size and quality of the sample is important so that the sample mean approaches the true mean, or, that the probability of the sample men being many SD’s away from µ approaches 0. • That’s why you have to discuss the sample quality (data source) in your Methods Section. • Discuss: bias in the sample … where does it come from? • Probability versus non-probability samples. • Simple probability sample. Psy6009 – Fall 2007 Leora Lawton, Ph.D.
Statistical Inference I Using Statistics to Understand Social Behavior Hypothesis Testing: H1≠ H0 You want to know: is your hypothesis supported? Is the your hypothesis different from the null hypothesis? Does behavior/attitude/outcome vary because of a causal or associational relationship that you have hypothesized? Is there a statistically significant difference between the results that suggests your hypothesis is supported? You derive your answer (reach a conclusion) that there is a difference (your hypothesis has support, you reject the null hypothesis?) Psy6009 – Fall 2007 Leora Lawton, Ph.D.
Statistical Inference I A statistical hypothesis is one that states your hypothesis in statistical terms: Not just “women earn less than men” but Women’s salaries are less than Men’s by 10% or more. What you need is a test statistic that essentially waves a flag saying the results between two groups (those with the influence, and those without) are different. Or not. To test differences between means you use a T-test, or, in a multivariate model, a coefficient. To test differences between distributions (and for binary multivariate models) you use a chi-square. To test differences between proportions, you use a chi-square or Z-test. Errors: Type I error: accepting one that is false Type II error: rejecting one that is true. Psy6009 – Fall 2007 Leora Lawton, Ph.D.
Summary Hypothesis Test Steps • Set up hypotheses. • Choose level of significance, α. • Pick sample size to fix β. • Collect Data. • Calculate Test statistic: Z, T, Chi-Square • For an online calculator, go to www.dimensionresearch.com/resources/calculators.html • Compare statistic with critical region in assumed distribution. • Draw conclusion. Psy6009 – Fall 2007 Leora Lawton, Ph.D.
The Test Statistics The T-Statistic for one mean: In words: The T-statistic is a function of your sample mean, the Null hypothesis mean, the sample variance, and the sample size, and Comparing two t-tests, you are testing for different means. The Z-Statistic for a distribution tests for different proportions: In words: The Z-statistic is a function of your sample mean, the Null hypothesis mean, the null hypothesis variance, and the sample size. Psy6009 – Fall 2007 Leora Lawton, Ph.D.
The Test Statistics Variance. • The variance (this term was first used by Fisher, 1918a) of a population of values is computed as: 2 = (xi-µ)2/N • whereµ is the population meanN is the population size.The unbiased sample estimate of the population variance is computed as: • s2 = (xi-xbar)2/n-1 • wherexbar is the sample meann is the sample size. Psy6009 – Fall 2007 Leora Lawton, Ph.D.
Hypothesis Testing The difference between two independent means, the test statistics are: Psy6009 – Fall 2007 Leora Lawton, Ph.D.
Chi-Square (χ2) Statistics Table 1. General notation for a 2 x 2 contingency table. For a 2 x 2 contingency table the Chi Square statistic is calculated by the formula: (ad – bc)2 (a + b + c + d) (a + b) (c+d) (b+d) (a+c) In other words, you are comparing the actual to the expected results and testing for differences in the distribution. X2 = Psy6009 – Fall 2007 Leora Lawton, Ph.D.
Correlation and Regression • Simple bivariate correlation is the slope of the line plotted by the values of the two variables. • For later: • Multiple regression is the slope of the line, too, but its calculation is more involved. Y = + x + Where Y is the predicted value of Y x is the predictor variable is the regression intercept when x = 0 is the regression coefficient, that is, the change in Y for a unit change in x (when x is standardized) is error. Psy6009 – Fall 2007 Leora Lawton, Ph.D.
PowerPoint Presentation Format • Title page with title of study, client and who prepared/issued the report. • Table of Contents • Executive summary • Objectives or background • Methodology (brief…details in appendix) • Key findings • Conclusions and recommendations • Detailed findings (slides supporting ES). • Each slide has the chart, table, etc. with a brief statement summarizing the result. • Clutter obfuscates, but at the same time, don’t treat the slides like a page out of Dick & Jane books. • Appendix Psy6009 – Fall 2007 Leora Lawton, Ph.D.
Psy6009 – Fall 2007 Leora Lawton, Ph.D.
Importance of Paperbound Acme Catalog for Online Purchasing Psy6009 – Fall 2007 Leora Lawton, Ph.D.
Correlation Bivariate: The slope of the line in a linear comparison of two (bi) variables (variate). Multivariate: The coefficient resulting from an equation predicting the slope of a line based the values of 2 or more independent variables and the dependent variable’s values. Most commonly we use Pearson’s two-tailed. Analyze – Correlate – Bivariate – select two variables – OK. Because the correlation between these two is so high (anything more than .7 is highly suspect) you would not want to use one to predict the other, or use both to explain something else. Correlation analysis can be used as a stand-alone method, or as a diagnostic tool for subsequent analyses. CORRELATIONS /VARIABLES=salary salbegin /PRINT=TWOTAIL NOSIG /MISSING=PAIRWISE . Psy6009 – Fall 2007 Leora Lawton, Ph.D.
Homework • Using the empsat data set on the website, calculate the correlation of a set of five similar scaled variables, similar in scale and in content. • Prepare a powerpoint report based on this set of variables. Your report should consist of these slides: objective, method, key findings, conclusions, with a slide of the output in a suitable format (table, output, graph or chart). Psy6009 – Fall 2007 Leora Lawton, Ph.D.
Regression coefficients But the true value of an OLS (ordinary least squares) regression is in considering multiple factors that could affect the value of Y. In this scenario, all factors are considered simultaneously, and the factor’s effect net of the other factors is actually included in the coefficient. Y = + 1x1 + 2 x2 + • Schwab, p.141 (Examples of Multiple Regression) shows how to calculate the beta coefficients. For this you’ll need the table on p. 136, and compare to the equation 11.3a. Let’s go through the math. • What you’ll notice is that for each coefficient, you need the sigma (standard deviation) • = [ (xi-µ)2/N]1/2 • whereµ is the population meanN is the population size. • You also need the correlations ρ for the variables in question. • In other words, the regression coefficients are the result of considering the sample size, the distribution of the mean (its standard deviation), and how much the individual variables correlate with each other. • Since you need the mean and its SD, you also need to realize then that certain kinds of variables for the dependent variable simply aren’t going to work well because the mean won’t be normally distributed. No bell curve or anything remotely similar. Psy6009 – Fall 2007 Leora Lawton, Ph.D.
Regression continued • Assumptions for OLS to work well • Dependent variable must be an ordered variable, with many values. • Linearity between relations. Scatterplots are very helpful for this. • It’s correlation not causality. • Have at least 10-20 times as cases as variables. • Look out for multicollinearity • Look out for outliers (conduct a residual analysis), or at the very least, run a frequencies and assign missing anything untoward. Psy6009 – Fall 2007 Leora Lawton, Ph.D.
Using SPSS to run an OLS regression • First, select an appropriate dv • Second select IVs • GSS93 subset.sav • Do you favor legalization of marijuana (grass) • How often watches tv shows (dv) • Age and education (iv) • Run frequencies • ANALYZE – REGRESSION – LINEAR • Dependent variables (click on variable and move to window) • IVs (click on age, educ) • Now let’s discuss the output Psy6009 – Fall 2007 Leora Lawton, Ph.D.