Download
1 / 35
350 likes | 385 Vues
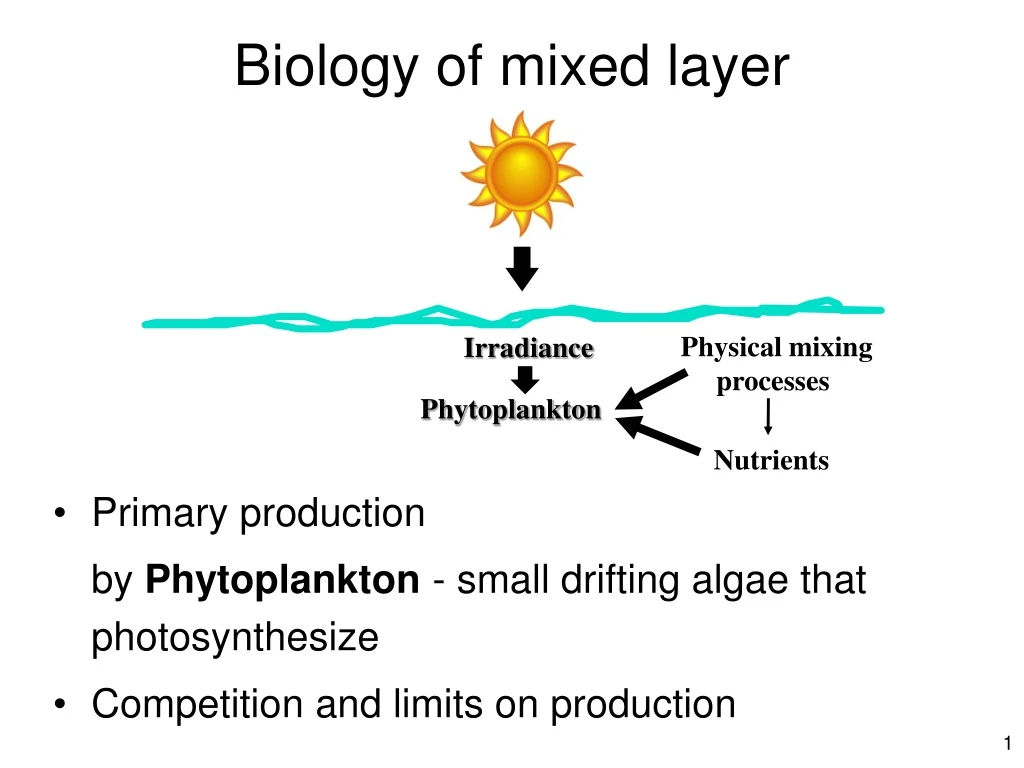
Biology of mixed layer. Physical mixing processes. Phytoplankton. Nutrients. Primary production by Phytoplankton - small drifting algae that photosynthesize Competition and limits on production. Irradiance. Photosynthesis (P). Carbon dioxide (C,O) + Water (H,O)

E N D
Biology of mixed layer Physical mixing processes Phytoplankton Nutrients • Primary production by Phytoplankton - small drifting algae that photosynthesize • Competition and limits on production Irradiance
Photosynthesis (P) Carbon dioxide (C,O) + Water (H,O) + Nutrients (N,P) + Light energy Oxygen (O) + Organic matter (C,H,O,N,P) Requires chloroplasts Plants, algae proteins fats carbohydrates nucleic acids AKA carbon fixation
Respiration (R) Carbon dioxide (C,O) + Water (H,O) + Nutrients (N,P) Oxygen (O) + Organic matter (C,H,O,N,P) Every living thing respires (plants too!) proteins fats carbohydrates nucleic acids
Primary Production - Definitions Gross Primary Production (GPP) = rate of carbon fixation by photosynthesis units = [Mass / Area / Time], e.g. [g C m-2 y-1] Respiration (R) = rate of carbon (CO2) loss through metabolism Net Primary Production (NPP) = GPP - ΣR Need NPP>0, i.e. GPP>ΣR for net growth!
Production ≠ Biomass • Production is a rate e.g. [g C m-2 y-1] • Biomass is a concentration e.g. [g C m-2]
“Paradox of the Plankton”There are many species of phytoplankton, despite few limiting resources and lots of mixing. Phytoplankton (single-celled primary producers) have various competitive strategies that enable coexistence.
Four major players • Small (<1 μm) or • Large (0.5-4 mm) • Nitrogen fixers • Large (2-200 μm) • Have silica frustules • Small (2-25 μm) • Have CaCO3 tests • Large (5-2000 μm) • Have unique life • cycle & blooms
What limits production? • Nutrients • Light • Intensity • Spectrum • Temperature
The environment varies in space and time. Different phytoplankton grow well under different conditions. Light Intensity Low High Narrow Broad Light Spectrum Low High Temperature High Low Nutrients Shallow water or mixed layer / Summer Deep water or mixed layer / Winter
Nutrients • N, P, Si, Fe • Nitrogen is most often limiting in ocean • Bioavailable forms of inorganic N: • Nitrate (NO3-) • Ammonium (NH4+) • Nitrite (NO2-)
Growth rate varies with [nutrient] μ = Specific growth rate (d-1) Curve “saturates” N = [Nutrient]
Growth rate varies with [nutrient] μmax μmax/2 Ks μ = Specific growth rate (d-1) “half-saturation constant” N = [Nutrient]
Growth rate varies with [nutrient] μmax μmax/2 Ks μ = Specific growth rate (d-1) Michaelis-Menten Kinetics “half-saturation constant” N = [Nutrient]
At low nutrient concentrations, smaller phytoplankton tend to grow faster r r Assume cell is a sphere. Surface area: Volume: Surface area to volume ratio: Smaller cells have relatively more surface area for taking up nutrients.
Different strategies of nutrient use • Coccolithophores • Low μmax • Low Ks • Diatoms • High μmax • High Ks High or variable nutrients High mixing, upwelling Low average irradiance High turbulence Chronically low nutrients Stratified conditions High average irradiance Low turbulence
Larger plankton (diatoms and dinoflagellates) most adapted to high-nutrient conditions. Light Intensity / Irradiance Low High Narrow Broad Light Spectrum Low High Temperature High Low Nutrients Shallow water or mixed layer / Summer Deep water or mixed layer / Winter
PAR = photosynthetically active radiation (visible light wavelengths) Irradiance = power of electromagnetic radiation per unit area of ocean’s surface (e.g. W m-2) - or - energy per area per time (e.g. mol photons m-2 s-1).
Light (PAR) attenuates with depth Iz Z0 Iz = irradiance at depth z Units of [Watts m-2] or [mol photons m-2 s-1] Light attenuates as it is absorbed and scattered by particles in the water. Z
Average Primary Production saturates at high PAR (photosynthetically active radiation) Hiscock et al. 2008
Species adapt to different light levels 1 0 Irradiance Photo-inhibition at high light levels Ryther 1956 Too much light damages cells and reduces photosynthesis (photo-inhibition)
Diatoms most adapted to low-light conditions Light Intensity / Irradiance Low High Narrow Broad Light Spectrum Low High Temperature High Low Nutrients Shallow water or mixed layer / Summer Deep water or mixed layer / Winter
Attenuation varies with wavelength. More wavelengths are available near the surface. Plankton use colored pigments to harvest light at different wavelengths. violet red
Different color pigments absorb different wavelengths of light Pigments (colored molecules) Phytoplankton with different pigments Chlorophyll*
Phytoplankton with multiple pigments capture more wavelengths • All phytoplankton have chlorophyll • Coccolithophores, dinos, & diatoms have carotenoids • Cyanobacteria have phycoerythrin, phycocyanin
Coccolithophores and Cyanobacteria most adapted to broad spectrum of light found in shallower mixed layer Light Intensity / Irradiance Low High Narrow Broad Light Spectrum Low High Temperature High Low Nutrients Shallow water or mixed layer / Summer Deep water or mixed layer / Winter
Growth-temperature curves vary among species but share upper limit Upper limit (Eppley 1972) Growth rate Temperature oC
Diatoms grow fastest at low temperatures Diatoms Flagellates Divisions per day Temperature oC
Diatoms most adapted to colder temperatures Light Intensity / Irradiance Low High Narrow Broad Light Spectrum Low High Temperature High Low Nutrients Shallow water or mixed layer / Summer Deep water or mixed layer / Winter
Production varies with depth • Production is a rate e.g. [g C m-2 y-1] • Biomass is a concentration e.g. [g C m-2]
Photosynthesis requires light, Respiration does not Photosynthesis or Production Respiration Depth Depth + biomass - biomass (Requires light) (Independent of light)
Compensation Depth R P P>R Biomass increases P = R Compensation depth P<R Biomass decreases Depth
Critical Depth ΣR GPP Gross Primary Production (GPP) Sum of Respiration (ΣR) Depth GPP=ΣR Net Primary Production (NPP) = 0 Critical depth
If critical depth > mixed layer depth, GPP>ΣR, NPP >0 ΣR GPP Gross Primary Production (GPP) Sum of Respiration (ΣR) Depth Bottom of mixed layer Critical depth
If critical depth < mixed layer depth, GPP<ΣR, NPP<0 ΣR GPP Gross Primary Production (GPP) Sum of Respiration (ΣR) Depth Critical depth Bottom of mixed layer
Critical depth concept is critical! Respiration Photosynthesis • Understand why R is a straight line • Understand why P is an exponential curve • Know the difference between: critical depth and compensation depth Depth