Download
1 / 8
400 likes | 943 Vues
Proportional Relationships and Slope. Proportional Relationships. A proportional relationship between two quantities is one in which the two quantities vary directly with one another.

E N D
Proportional Relationships A proportional relationship between two quantities is one in which the two quantities vary directly with one another. Example: If one item is doubled, the other, related item is also doubled. The equations of direct variation relationships are always in the form y=mx.
Slope and Proportional Relationships On the previous slide, the equation y=mx referred to a direct variation equation. In this equation, m is the slope of the line and it is also called the unit rate, the rate of change, or the constant of proportionality of the function.
Examples • Gasoline cost $4.24 per gallon. • Create a table to represent the two quantities, gallons of gas and price. • Graph the quantities from the chart. • Create the equation given the chart and the graph.
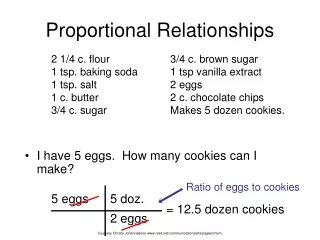
Examples 2. Five Gala apples cost $2.00 1. Create a table relating the number of apples to their cost. 2. Graph the information from the table. 3. Create the equation using the table and the graph.
Examples 3. Tess riders her bike at 12 mph. 1. Create a table relating number of hours riding and distance travelled. 2. Create a graph using the table. 3. Create an equation using the graph and the table.
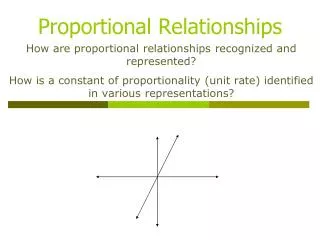
What is slope? Slope describes the steepness of a line. It is also referred to as the rate of change or the unit rate. Can also be referred to as rise over run when looking at a graph.
The 4 types of Slope Zero Slope – A horizontal line has a slope of zero Undefined Slope – A vertical line has an undefined slope Negative Slope – A line that falls from left to right has a negative slope Positive Slope – A line that rises from left to right has a positive slope