Download
1 / 17
190 likes | 1.3k Vues
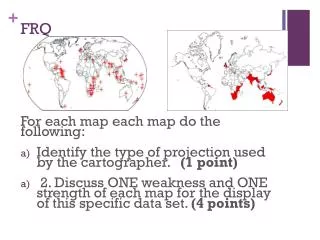
AP FRQ. Religion and Migration. 2002. Using the letters in the legend, name the three religious groups shown on the map. For ONE of these religious groups, first identify and then explain TWO factors that have influenced the distribution shown on the map.

E N D
AP FRQ Religion and Migration
Using the letters in the legend, name the three religious groups shown on the map. • For ONE of these religious groups, first identify and then explain TWO factors that have influenced the distribution shown on the map. • Explain how the map as presented at this scale is an incomplete representation of the geography of religion in the United States. The map shows the religious distribution of three religious groups in the contiguous US.
Underline key words/phrases in the question itself. Circle specific requirements of the question. • Using the letters in the legend, name the three religious groups shown on the map. • For ONE of these religious groups, first identify and then explain TWO factors that have influenced the distribution shown on the map. • Explain how the map as presented at this scale is an incomplete representation of the geography of religion in the United States. The map shows the religious distribution of three religious groups in the contiguous US.
Underline key words/phrases in the question itself. Circle specific requirements of the question. • Using the letters in the legend, name the three religious groups shown on the map. • For ONE of these religious groups, first identify and then explain TWO factors that have influenced the distribution shown on the map. • Explain how the map as presented at this scale is an incomplete representation of the geography of religion in the United States. The map shows the religious distribution of three religious groups in the contiguous US.
Jot down key terms/people/examples/etc. that will be a part of your response. Make “thumbnail outline.” • Using the letters in the legend, name the three religious groups shown on the map. • For ONE of these religious groups, first identify and then explain TWO factors that have influenced the distribution shown on the map. • Explain how the map as presented at this scale is an incomplete representation of the geography of religion in the United States. The map shows the religious distribution of three religious groups in the contiguous US.
Answer the question in the order it is asked. If the question is organized “A…B…C…,” then answer it “A…B…C…” • Using the letters in the legend, name the three religious groups shown on the map. • For ONE of these religious groups, first identify and then explain TWO factors that have influenced the distribution shown on the map. • Explain how the map as presented at this scale is an incomplete representation of the geography of religion in the United States. The map shows the religious distribution of three religious groups in the contiguous US.
Answer each section of the question COMPLETELY. When you have answered a part of the question (now underlined and circled) cross it off. • Using the letters in the legend, name the three religious groups shown on the map. • For ONE of these religious groups, first identify and then explain TWO factors that have influenced the distribution shown on the map. • Explain how the map as presented at this scale is an incomplete representation of the geography of religion in the United States. The map shows the religious distribution of three religious groups in the contiguous US.
Be specific. Avoid vague statements. Do NOT assume the reader is an expert in the topic. • Using the letters in the legend, name the three religious groups shown on the map. • For ONE of these religious groups, first identify and then explain TWO factors that have influenced the distribution shown on the map. • Explain how the map as presented at this scale is an incomplete representation of the geography of religion in the United States. The map shows the religious distribution of three religious groups in the contiguous US.
Using the letters in the legend, name the three religious groups shown on the map. • For ONE of these religious groups, first identify and then explain TWO factors that have influenced the distribution shown on the map. • Explain how the map as presented at this scale is an incomplete representation of the geography of religion in the United States. The map shows the religious distribution of three religious groups in the contiguous US.
Using the letters in the legend, name the three religious groups shown on the map. 3 points X = Mormon Y= Lutheran Z = Baptist or Southern Baptist
Part B = 4 points 2 factor points, and 2 explanation points • For ONE of these religious groups, first identify and then explain TWO factors that have influenced the distribution shown on the map.
Part B = 4 points 2 factor points, and 2 explanation points • For ONE of these religious groups, first identify and then explain TWO factors that have influenced the distribution shown on the map.
Part B = 4 points 2 factor points, and 2 explanation points • For ONE of these religious groups, first identify and then explain TWO factors that have influenced the distribution shown on the map.
1 point Explain how the map as presented at this scale is an incomplete representation of the geography of religion in the United States • Map does not show small areas where other religions dominate. • Map does not show areas where density of adherents is really high. Map gives greater importance to small populations. • Map makes much diversity and variation in religions. • Not able to view sub-county variation. • Map overgeneralizes.


![How to… Solve AP Calculus BC FRQ [2007]](https://cdn3.slideserve.com/6904807/how-to-solve-ap-calculus-bc-frq-2007-dt.jpg)