Download
1 / 18
190 likes | 324 Vues
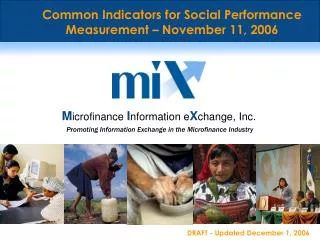
Microfinance Information eXchange, Inc. Promoting Information Exchange in the Microfinance Industry. www.themix.org. Benchmarking Nepal’s Microfinance Banks 2006. M icrofinance I nformation e X change, Inc. Nepal’s MFBs at a glance

E N D
Microfinance Information eXchange, Inc Promoting Information Exchange in the Microfinance Industry www.themix.org
Benchmarking Nepal’s Microfinance Banks 2006 MicrofinanceInformationeXchange, Inc.
Nepal’s MFBs at a glance • Outreach and growth compare favorably with global norms but fall behind regional trends. • Microfinance banks (MFBs) focus mostly on credit provision and serve a broad market segment. • The sector relies heavily on borrowed funds and is among the most leveraged in the region. • MFBs generate weak, but positive returns thanks to a tight cost structure. • Sample: 2006 outreach information from 18 MFIs; performance information from 9 MFBs – 4 microfinance development banks (MFDBs) and 5 regional rural development banks (RRDBs); data are adjusted for subsidy, minimal provisioning, and inflation
Outreach and scale Source: Microfinance Information Exchange, Inc., 2006 benchmarks.
Depth of outreach Source: Microfinance Information Exchange, Inc., 2006 benchmarks.
Modes of MFI financing Source: Microfinance Information Exchange, Inc., 2006 benchmarks.
Breaking down return on assets Source: Microfinance Information Exchange, Inc., 2006 benchmarks.
Outreach is led by MFBs but remains limited Number of active borrowers – individual MFI results • Surveyed MFIs reach 376,000 borrowers with USD 46 million in loans. • Propelled by strong staff productivity, microfinance banks dominate outreach. Source: Microfinance Information Exchange, Inc., MIX Market, 2006 data as of Feb. 2008.
Growth is solid though falls behind regional norms • Over the 2005-06 financial year, combined outreach grew by 22%, and the typical institution grew by 27% - in line with global trends. • MFDBs led growth and boosted their coverage by 34%. • RRDBs stagnated at 4%, reflecting the current restructuring as well as their greater vulnerability to the insurgency. Growth in outreach - medians Source: Microfinance Information Exchange, Inc., MIX Market, 2006 data as of Feb. 2008.
Significant share of the market remains untapped Depth of outreach - medians • In 2006, the average loan balance stood at USD 137 – less than one-third the global benchmark. • This figure, however, amounts to half of the local income level, indicating lower depth than elsewhere in South Asia. Source: Microfinance Information Exchange, Inc., MIX Market, 2006 data as of Feb. 2008.
Service diversification could help boost outreach • MFBs are legally authorized to mobilize deposits, but these institutions typically reach half as many depositors as borrowers. • Generally, the amount of voluntary deposits at an individual MFB barely exceeds USD 250,000 – less than 5% of loans under management. • Compulsory deposits are more important, and on the whole, MFBs collect over 3x as much funds in compulsory as in voluntary deposits – USD 9.8 vs. 2.8 million. • Tapping further into the savings market could draw more clients into microfinance services and provide an additional source of funds for growth in the credit market.
MFBs draw heavily on borrowed funds for financing • MFBs are among the most leveraged institutions in the region, raising 13.5x their equity in debt, compared to 4.2x across South Asia and 2.6x at the global level. • At the end of the year, outstanding borrowings exceeded MFB portfolios and amounted to 138% of loans managed by the typical MFB. Sources of funds - consolidated Source: Microfinance Information Exchange, Inc., 2006 benchmarks.
Large share of assets invested elsewhere • Median asset allocation to the loan portfolio stood at 54% among MFBs vs. over 75% across South Asia and the globe. • Lenders themselves may push institutions towards safer investment alternatives to ensure their own returns. • MFBs will have to bolster the returns on their microfinance operations to attract investors. Asset allocation - consolidated Source: Microfinance Information Exchange, Inc., 2006 benchmarks.
MFBs generate weak, but positive returns • Most MFBs are profitable or on the verge of breaking even, though typical returns stand at a precarious 0.1% of assets. • These returns compare favorably with those achieved in Afghanistan and Pakistan but fall short of the healthy 2.8% generated by Bangladeshi MFIs. Return on assets – individual MFB results Source: Microfinance Information Exchange, Inc., 2006 benchmarks.
MFB returns are boosted by low costs • MFBs earn the lowest revenues in the region – 12% compared to 18% of assets across South Asia. • These low levels are partly due to low portfolio allocation, but MFBs also yields that are 5 points below regional norms. • Due to low cost structures, however, these yields suffice to cover operating expenses. Yields and costs on the loan portfolio - medians Source: Microfinance Information Exchange, Inc., 2006 benchmarks.
Poor portfolio quality drains revenues • At 4.7%, portfolio at risk >30 days among MFBs is the highest in the region. • The typical MFB lost 4.2% of its portfolio on account of defaults, significantly draining its revenue stream. • The situation is particularly acute among RRDBs, which, on average, lost 12% of their portfolio over the course of the year. Portfolio Quality - medians Source: Microfinance Information Exchange, Inc., 2006 benchmarks.
Concluding remarks • The sector’s low cost structure can act as a springboard for boosting profits, but institutions will have to strengthen their revenue streams to ensure the sustainability of the sector. • Poor portfolio quality weakens revenues, and MFBs could greatly benefit from best practice dissemination and technical assistance in the area of portfolio risk management. • MFBs, and RRDBs in particular, should adopt appropriate product-pricing policies that not only cover the direct costs of service provision but also allow for provisioning and funding expenses.
Microfinance Information eXchange, Inc Promoting Information Exchange in the Microfinance Industry MIX Headquarters1901 Pennsylvania Avenue, NW Suite 307Washington, DC 20006, USATel: +1 (202) 659-9094Fax: +1 (202) 659-9095www.themix.org MIX America Latina | Lima, PeruTel: +51 471-9526 | mgehrke@themix.orgMIX West Africa | Dakar, SenegalTel: +221 820 55 07| ccordier@themix.orgMIX India | Gurgaon, IndiaTel: +91 124 230 9497 | india@themix.org