Download
1 / 1
10 likes | 142 Vues
Analysis of Ewing's Sarcoma Genome Wide Association Study (GWAS) Data Using Pathways of Distinction Analysis ( PoDA ).

E N D
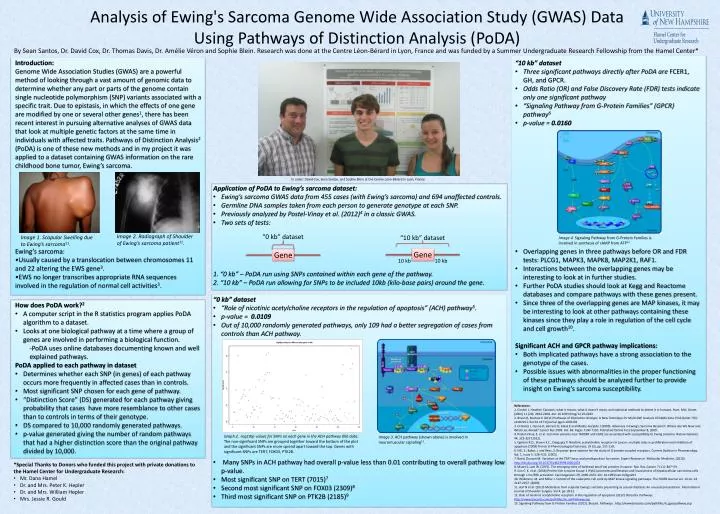
Analysis of Ewing's Sarcoma Genome Wide Association Study (GWAS) Data Using Pathways of Distinction Analysis (PoDA) By Sean Santos, Dr. David Cox, Dr. Thomas Davis, Dr. AmélieVéron and Sophie Blein. Research was done at the Centre Léon-Bérard in Lyon, France and was funded by a Summer Undergraduate Research Fellowship from the Hamel Center* Introduction: Genome Wide Association Studies (GWAS) are a powerful method of looking through a vast amount of genomic data to determine whether any part or parts of the genome contain single nucleotide polymorphism (SNP) variants associated with a specific trait. Due to epistasis, in which the effects of one gene are modified by one or several other genes1, there has been recent interest in pursuing alternative analyses of GWAS data that look at multiple genetic factors at the same time in individuals with affected traits. Pathways of Distinction Analysis2(PoDA) is one of these new methods and in my project it was applied to a dataset containing GWAS information on the rare childhood bone tumor, Ewing’s sarcoma. Ewing’s sarcoma: •Usually caused by a translocation between chromosomes 11 and 22 altering the EWS gene3. •EWS no longer transcribes appropriate RNA sequences involved in the regulation of normal cell activities3. • “10 kb” dataset • Three significant pathways directly after PoDA are FCER1, GH, and GPCR. • Odds Ratio (OR) and False Discovery Rate (FDR) tests indicate only one significant pathway • “Signaling Pathway from G-Protein Families” (GPCR) pathway6 • p-value = 0.0160 • Overlapping genes in three pathways before OR and FDR tests: PLCG1, MAPK3, MAPK8, MAP2K1, RAF1. • Interactions between the overlapping genes may be interesting to look at in further studies. • Further PoDA studies should look at Kegg and Reactome databases and compare pathways with these genes present. • Since three of the overlapping genes are MAP kinases, it may be interesting to look at other pathways containing these kinases since they play a role in regulation of the cell cycle and cell growth10. • Significant ACH and GPCR pathway implications: • Both implicated pathways have a strong association to the genotype of the cases. • Possible issues with abnormalities in the proper functioning of these pathways should be analyzed further to provide insight on Ewing’s sarcoma susceptibility. In order: David Cox, Sean Santos, and Sophie Blein at the Centre Léon-Bérard in Lyon, France • Application of PoDA to Ewing’s sarcoma dataset: • Ewing’s sarcoma GWAS data from 455 cases (with Ewing’s sarcoma) and 694 unaffected controls. • Germline DNA samples taken from each person to generate genotype at each SNP. • Previously analyzed by Postel-Vinay et al. (2012)4 in a classic GWAS. • Two sets of tests: • 1. “0 kb” – PoDA run using SNPs contained within each gene of the pathway. • 2. “10 kb” – PoDA run allowing for SNPs to be included 10kb (kilo-base pairs) around the gene. “0 kb” dataset Image 2. Radiograph of Shoulder of Ewing’s sarcoma patient11. “10 kb” dataset Image 1. Scapular Swelling due to Ewing’s sarcoma11. Image 4. Signaling Pathway from G-Protein Families is involved in synthesis of cAMP from ATP13 Gene Gene 10 kb 10 kb • “0 kb” dataset • “Role of nicotinic acetylcholine receptors in the regulation of apoptosis” (ACH) pathway5. • p-value = 0.0109 • Out of 10,000 randomly generated pathways, only 109 had a better segregation of cases from controls than ACH pathway. • Many SNPs in ACH pathway had overall p-value less than 0.01 contributing to overall pathway low p-value. • Most significant SNP on TERT (7015)7 • Second most significant SNP on FOX03 (2309)8 • Third most significant SNP on PTK2B (2185)9 • How does PoDA work?2 • A computer script in the R statistics program applies PoDA algorithm to a dataset. • Looks at one biological pathway at a time where a group of genes are involved in performing a biological function. • -PoDA uses online databases documenting known and well • explained pathways. • PoDA applied to each pathway in dataset • Determines whether each SNP (in genes) of each pathway occurs more frequently in affected cases than in controls. • Most significant SNP chosen for each gene of pathway. • “Distinction Score” (DS) generated for each pathway giving probability that cases have more resemblance to other cases than to controls in terms of their genotype. • DS compared to 10,000 randomly generated pathways. • p-value generated giving the number of random pathways that had a higher distinction score than the original pathway divided by 10,000. References: 1. Cordel, J, Heather. Epistasis: what it means, what it doesn't mean, and statistical methods to detect it in humans. Hum. Mol. Genet. (2002) 11 (20): 2463-2468. doi: 10.1093/hmg/11.20.2463 2. Braun R, Buetow K (2011) Pathways of Distinction Analysis: A New Technique for Multi-SNP Analysis of GWAS data. PloS Genet 7(6): e1002101. doi:10.1371/journal.pgen.1002101 3. Ordonez J, Osuna D, Herrero D, Alava E and Madoz-Gurpide J (2009). Advances in Ewing’s Sarcoma Research: Where Are We Now and What Lies Ahead? Cancer Res 2009. Vol. 69. Pages 7140-7150. Published Online First September 8, 2009. 4. Postel-Vinay, S. et al. Common variants near TARDBP and EGR2 are associated with susceptibility to Ewing sarcoma. Nature Genetics 44, 323-327 (2012). 5. Egleton R.D., Brown K.C., Dasgupta P. Nicotinic acetylcholine receptors in cancer: multiple roles in proliferation and inhibition of apoptosis (2008) Trends in Pharmacological Sciences, 29 (3), pp. 151-158. 6. Hill, S., Baker, J. and Rees, S. Reporter-gene systems for the study of G-protein-coupled receptors. Current Opinion in Pharmacology. Vol. 1, Issue 5. 526–532. (2001) 7. Baird, Duncan M. Variation at the TERT locus and predisposition for cancer. Expert Reviews in Molecular Medicine. (2010) http://dx.doi.org/10.1017/S146239941000147X 8. Myatt S, Lam W. (2007). The emerging roles of forkhead box (Fox) proteins in cancer. Nat. Rev. Cancer 7 (11): 847–59. 9. Sun C. K. et al. (2008) Proline-rich tyrosine kinase 2 (Pyk2) promotes proliferation and invasiveness of hepatocellular carcinoma cells through c-Src/ERK activation. Carcinogenesis 29, 2096-2105. doi: 10.1093/carcin/bgn203 10. Wilkinson, M. and Millar J. Control of the eukaryotic cell cycle by MAP kinase signaling pathways. The FASEB Journal vol. 14 no. 14 2147-2157. (2000) 11. Asif N et al. (2010) Metastasis from scapular Ewing's sarcoma presenting as sutural diastasis: An unusual presentation. International Journal of Shoulder Surgery. Vol 4, pp 18-21. 12. Role of nicotinic acetylcholine receptors in the regulation of apoptosis (2012). Biocarta. Pathways. http://www.biocarta.com/pathfiles/m_achPathway.asp 13. Signaling Pathway from G-Protein Families (2012). Biocart. Pathways . http://www.biocarta.com/pathfiles/h_gpcrpathway.asp Graph 2, -log10(p-value) for SNPs on each gene in the ACH pathway 0kb data. The non-significant SNPs are grouped together toward the bottom of the plot and the significant SNPs are more spread apart toward the top. Genes with significant SNPs are TERT, FOX03, PTK2B. Image 3. ACH pathway (shown above) is involved in neuromuscular signaling12. • *Special Thanks to Donors who funded this project with private donations to the Hamel Center for Undergraduate Research: • Mr. Dana Hamel • Dr. and Mrs. Peter K. Hepler • Dr. and Mrs. William Hepler • Mrs. Jessie R. Gould