Download
1 / 92
920 likes | 1.13k Vues
Auditory-Visual Integration: Implications for the New Millennium. 100. NH - Auditory Consonants. 90. HI Auditory Consonants. 80. 70. HI-Auditory Sentences. 60. Percent Correct Recognition. ASR Sentences. 50. 40. 30. 20. 10. 0. -15. -10. -5. 0. 5. 10. 15. 20.

E N D
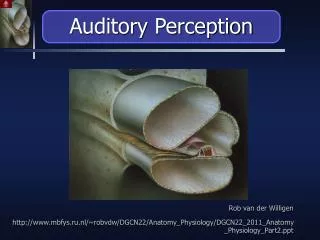
Auditory-Visual Integration: Implications for the New Millennium
100 NH - Auditory Consonants 90 HI Auditory Consonants 80 70 HI-Auditory Sentences 60 Percent Correct Recognition ASR Sentences 50 40 30 20 10 0 -15 -10 -5 0 5 10 15 20 Speech-to-Noise Ratio (dB) Speech Recognition by Man and Machine
100 NH - Audiovisual Consonants 90 NH - Auditory Consonants 80 HI - Audiovisual Consonants 70 60 HI Auditory Consonants Percent Correct Recognition 50 HI-Auditory Sentences 40 ASR Sentences 30 20 10 0 -15 -10 -5 0 5 10 15 20 Speech-to-Noise Ratio (dB) Auditory-Visual vs. Audio Speech Recognition
Automatic Speech Recognition Hearing Aid Technology Synthetic Speech Learning and Education - Classrooms Foreign Language Training Common Problems – Common Solutions
How It All Works - The Prevailing View • Information extracted from both sources independently • Integration of extracted information • Decision statistic Evaluation Integration Decision From Massaro, 1998
Provide segmental information that is redundant with acoustic information vowels Possible Roles of Speechreading
Possible Roles of Speechreading • Provide segmental information that is redundant with acoustic information • vowels • Provide segmental information that is complementary with acoustic information • consonants
Possible Roles of Speechreading • Provide segmental information that is redundant with acoustic information • vowels • Provide segmental information that is complementary with acoustic information • consonants • Direct auditory analyses to the target signal • who, where, when, what (spectral)
Visual Feature Distribution 0% 3% 4% Voicing Manner Place Other 93% %Information Transmitted re: Total Information Received
100 80 60 Aided Auditory 40 Voicing 20 Manner Place 0 0 20 40 60 80 100 Unaided Auditory Speech Feature Distribution - Aided A
Voicing Manner Place Speech Feature Distribution - Unaided AV 100 80 60 Unaided Auditory-Visual 40 20 0 0 20 40 60 80 100 Unaided Auditory
Speech Feature Distribution - Aided AV 100 80 60 Aided Auditory-Visual 40 Voicing Manner 20 Place 0 0 20 40 60 80 100 Unaided Auditory
Hypothetical Consonant Recognition - Perfect Feature Transmission 1 0.8 0.6 Probability Correct 0.4 0.2 0 Voicing Manner Place Voicing + Manner Feature(s) Transmitted Auditory consonant recognition based on perfect transmission of indicated feature. Responses within each feature category were uniformly distributed. A Visual Consonant recognition. Data from 11 normally-hearing subjects (Grant and Walden, 1996). V Predicted AV consonant recognition based on PRE model of integration (Braida, 1991). PRE
Feature Distribution re: Center Frequency 100 90 80 70 60 Percent Information Transmitted (re: Total Received) 50 40 30 20 Voicing + Manner 10 Place 0 0 1000 2000 3000 4000 5000 Bandwidth Center Frequency (Hz)
Summary: Hearing Aids and AV Speech • Hearing aids enhance all speech features to some extent • Place cues are enhanced the most • Voicing cues are enhanced the least • Visual cues enhance mostly place cues, with little support to manner and virtually no support to voicing • Model predictions show that auditory place cues are redundant with speechreading and offer little benefit under AV conditions. • Model predictions also show that AV speech recognition is best supported by auditory cues for voicing and manner • Voicing and manner cues are best represented acoustically in the low frequencies (below 500 Hz).
The Independence of Sensory Systems??? • Information is extracted independently from A and V modalities • Early versus Late Integration • Most models are "late integration" models
The Independence of Sensory Systems ??? • Information is extracted independently from A and V modalities • Early versus Late Integration • Most models are "late integration" models • BUT • Speechreading activates primary auditory cortex (cf. Sams et al., 1991)
The Independence of Sensory Systems??? • Information is extracted independently from A and V modalities • Early versus Late Integration • Most models are "late integration" models • BUT • Speechreading activates primary auditory cortex (cf. Sams et al., 1991) • Population of neurons in cat Superior Colliculus respond only to bimodal input (cf. Stein and Meredith, 1993)
Sensory Integration: Many Questions • How is the auditory system modulated by visual speech activity? • What is the temporal window governing this interaction?
The Effect of Speechreading on Masked Detection Thresholds for Spoken Sentences Ken W. Grant and Philip Franz Seitz Army Audiology and Speech Center Walter Reed Army Medical Center Washington, D.C. 20307, USA http://www.wramc.amedd.army.mil/departments/aasc/avlab/ grant@tidalwave.net
Acknowledgments and Thanks Technical Assistance Philip Franz Seitz Research Funding National Institutes for Health
CMP (Gordon, 1997a,b) Identification or classification of acoustic signals in noise is improved by adding additional signal components which are non-informative by themselves, provided that the relevant and non-relevant signal components “cohere” in some way (e.g., common fundamental frequency, common onset and offset, etc.) Coherence Masking Protection
BCMP (Grant and Seitz, 2000, Grant, 2001) Detection of speech in noise is improved by watching a talker (i.e., speechreading) as they produce the target speech signal, provided that the "visible" movement of the lips and acoustic amplitude envelope are highly correlated. Bimodal Coherence Masking Protection
Acoustic/Optic Relationship Reduction of Signal Uncertainty in time domain in spectral domain Greater Neural Drive to Cognitive Centers neural priming - auditory cortex bimodal cells in superior colliculus Bimodal Coherence
Auditory-only speech detection Auditory-visual speech detection speech speech Basic Paradigm for BCMP ... ... noise noise noise noise
9 Interleaved Tracks - 2IFC Sentence Detection in Noise 3 Audio target sentences - IEEE/Harvard Corpus Same 3 target sentences with matched video Same 3 target sentences with unmatched video (from 3 additional sentences) White noise masker centered on target with random 100-300 ms extra onset and offset duration 10 Normal-Hearing Subjects Experiment 1: Natural Speech
Congruent versus Incongruent Speech -26 A AV M -25 AV UM -24 Masked Threshold (dB) -23 -22 -21 Sentence 1 Sentence 2 Sentence 3 Average Target Sentence
BCMP for Congruent and Incongruent Speech 3.0 AV M 2.5 AV UM 2.15 2.0 1.70 1.56 1.5 Bimodal Coherence Protection (dB) 0.84 1.0 0.5 0.16 0.07 0.06 0.0 -0.05 -0.5 -1.0 Sentence 1 Sentence 2 Sentence 3 Average Target Sentence
Acoustic Envelope and Lip Area Functions 80 WB 70 F1 F2 60 F3 50 RMS Amplitude (dB) 40 30 20 10 0 Watch the log float in the wide river 2.5 2.0 1.5 Lip Area (in2) 1.0 0.5 0.0 0 500 1000 1500 2000 2500 3000 3500 Time (ms)
e p o l e v n E S M R Cross Modality Correlation - Lip Area versus Amplitude Envelope Sentence 3 Sentence 2 WB r=0.52 r=0.35 F1 r=0.49 r=0.32 F2 r=0.65 r=0.47 F3 r=0.60 r=0.45 Lip Area Lip Area
1.0 0.8 0.6 0.4 0.2 Correlation Coefficient 80 0 70 -0.2 60 50 -0.4 RMS Amplitude (dB) 40 -0.6 30 20 -0.8 Watch the log float in the wide river 10 0 -1.0 0 500 1000 1500 2000 2500 3000 3500 Time (ms) Local Correlations (Lip Area versus F2-Amplitude Envelope
Local Correlations (Lip Area versus F2-Amplitude Envelope 1.0 0.8 0.6 0.4 0.2 Correlation Coefficient 0.0 80 70 -0.2 60 50 -0.4 RMS Amplitude (dB) 40 -0.6 30 20 -0.8 Both brothers wear the same size 10 -1.0 0 0 500 1000 1500 2000 2500 3000 3500 Time (ms)
speech Methodology for Orthographic BCMP • Auditory-only speech detection • Auditory + orthographic speech detection ... ... text speech noise noise noise noise
6 Interleaved Tracks - 2IFC Sentence Detection in Noise 3 Audio target sentences - IEEE/Harvard Corpus Same 3 target sentences with matched orthography White noise masker centered on target with random 100-300 ms extra onset and offset duration 6 Normal-Hearing Subjects (from EXP 1) Experiment 2: Orthography
BCMP for Orthographic Speech 1.5 1 0.78 Bimodal Coherence Protection (dB) 0.50 0.5 0.38 0.33 0 Sentence 1 Sentence 2 Sentence 3 Average Target Sentence
speech speech Methodology for Filtered BCMP F1 (100-800 Hz) F2 (800-2200 Hz) • Auditory-only detection of filtered speech • Auditory-visual detection of filtered speech ... ... noise noise noise noise
Experiment 3: Filtered Speech • 6 Interleaved Tracks - 2IFC Sentence Detection in Noise • 2 Audio target sentences - IEEE/Harvard Corpus - each filtered into F1 and F2 bands • Same 2 target sentences that produced largest BCMP • White noise masker centered on target with random 100-300 ms extra onset and offset duration • 6 Normal-Hearing Subjects (from EXP 2)
3 AV F1 AV F2 2.5 AV WB AV O 2 Masking Protection (dB) 1.5 1 0.5 0 Sentence 2 Sentence 3 Average Target Sentence BCMP for Filtered Speech
0 0 50 50 100 100 150 150 200 200 250 250 300 300 350 350 Cross Modality Correlations (lip area versus acoustic envelope) 1 80 1 80 S2 S2 0.8 0.8 70 70 0.6 0.6 60 60 0.4 0.4 50 50 0.2 0.2 Correlation Coefficient Correlation Coefficient Peak Amplitude (dB) Peak Amplitude (dB) 0 40 0 40 -0.2 -0.2 30 30 -0.4 -0.4 20 20 -0.6 -0.6 10 10 -0.8 -0.8 F1 F2 -1 0 -1 0 1 80 1 80 S3 S3 0.8 0.8 70 70 0.6 0.6 60 60 0.4 0.4 50 50 0.2 0.2 Correlation Coefficient Correlation Coefficient Peak Amplitude (dB) Peak Amplitude (dB) 0 40 0 40 -0.2 -0.2 30 30 -0.4 -0.4 20 20 -0.6 -0.6 10 10 -0.8 -0.8 F1 F2 -1 0 -1 0 Time (ms) Time (ms)
Speechreading reduces auditory speech detection thresholds by about 1.5 dB (range: 1-3 dB depending on sentence) BCMP – Summary
BCMP – Summary • Speechreading reduces auditory speech detection thresholds by about 1.5 dB (range: 1-3 dB depending on sentence) • Amount of BCMP depends on the degree of coherence between acoustic envelope and facial kinematics
BCMP – Summary • Speechreading reduces auditory speech detection thresholds by about 1.5 dB (range: 1-3 dB depending on sentence) • Amount of BCMP depends on the degree of coherence between acoustic envelope and facial kinematics • Providing listeners with explicit (orthographic) knowledge of the identity of the target sentence reduces speech detection thresholds by about 0.5 dB, independent of the specific target sentence
BCMP – Summary • Speechreading reduces auditory speech detection thresholds by about 1.5 dB (range: 1-3 dB depending on sentence) • Amount of BCMP depends on the degree of coherence between acoustic envelope and facial kinematics • Providing listeners with explicit (orthographic) knowledge of the identity of the target sentence reduces speech detection thresholds by about 0.5 dB, independent of the specific target sentence • Manipulating the degree of coherence between area of mouth opening and acoustic envelope by filtering the target speech has a direct effect on BCMP
Speech Intelligibility Derived from Asynchronous Processing of Auditory-Visual Information Ken W. Grant Army Audiology and Speech Center Walter Reed Army Medical Center Washington, D.C. 20307, USA http://www.wramc.amedd.army.mil/departments/aasc/avlab grant@tidalwave.net Steven Greenberg International Computer Science Institute 1947 Center Street, Berkeley, CA 94704, USA http://www.icsi.berkeley.edu/~steveng steveng@icsi.berkeley.edu
Acknowledgments and Thanks Technical Assistance Takayuki Arai, Rosaria Silipo Research Funding U.S. National Science Foundation
Time-Course of Spectral-Temporal Integration Within Modality 4 narrow spectral slits delay two middle bands with respect to outer bands Across Modality 2 narrow spectral slits (2 outer bands) delay audio with respect to video Spectral-Temporal Integration
+ Video Leads Audio Leads 40 – 400 ms 40 – 400 ms + Baseline Condition SYNCHRONOUS A/V Auditory-Visual Asynchrony - Paradigm Video of spoken (Harvard/IEEE) sentences, presented in tandem with a sparse spectral representation (low- and high-frequency slits) of the same material
Auditory-Visual Integration - Preview When the AUDIO signal LEADS the VIDEO, there is a progressive decline in intelligibility, similar to that observed for audio-alone signals When the VIDEO signal LEADS the AUDIO, intelligibility is preserved for asynchrony intervals as long as 200 ms Why? Why? Why? We’ll return to these data shortly But first, let’s take a look at audio-alone speech intelligibility data in order to gain some perspective on the audio-visual case The audio-alone data come from earlier studies by Greenberg and colleagues using TIMIT sentences 9 Subjects
AUDIO-ALONE EXPERIMENTS