Download
1 / 7
70 likes | 149 Vues
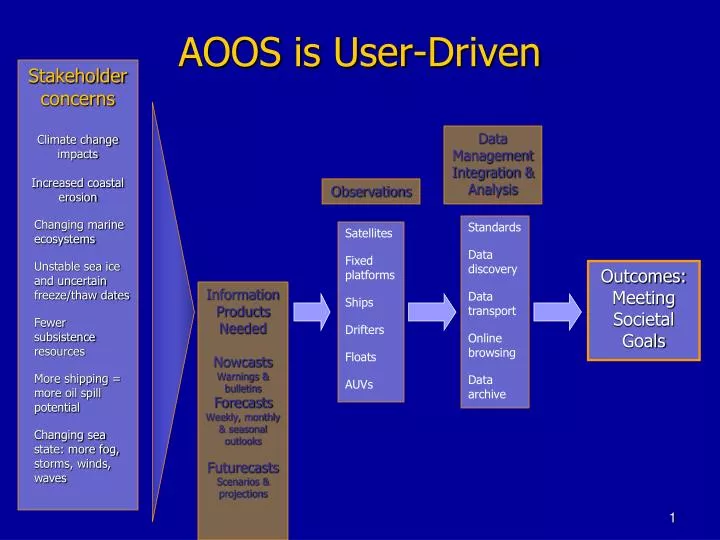
AOOS is User-Driven. Stakeholder concerns Climate change impacts Increased coastal erosion Changing marine ecosystems Unstable sea ice and uncertain freeze/thaw dates Fewer subsistence resources More shipping = more oil spill potential Changing sea state: more fog, storms, winds, waves.

E N D
AOOS is User-Driven • Stakeholder concerns • Climate change impacts • Increased coastal erosion • Changing marine ecosystems • Unstable sea ice and uncertain freeze/thaw dates • Fewer subsistence resources • More shipping = more oil spill potential • Changing sea state: more fog, storms, winds, waves Data Management Integration & Analysis Observations Standards Data discovery Data transport Online browsing Data archive Satellites Fixed platforms Ships Drifters Floats AUVs Outcomes: Meeting Societal Goals Information Products Needed Nowcasts Warnings & bulletins Forecasts Weekly, monthly & seasonal outlooks Futurecasts Scenarios & projections
AOOS Stakeholder needsbased upon 100+ meetings & interviews Safe marine operations • Improved, real-time ocean conditions and forecasts • Real-time sea ice conditions (thickness, extent, movement) and forecasts • Improved search and rescue • Oil spill response Fisheries, changing marine ecosystems • Climate change impacts • Ocean temperature, acidity, salinity • Changes to food webs • Impacts to commercial & subsistence uses Natural hazard mitigation • Coastal erosion impacts • Wave height & direction and storm surge modeling • Landfast and sea ice conditions Climate change impacts • Changing ocean conditions – nowcasts and forcasts • Changing sea ice • Changes to freshwater input • Changes to sea ice thickness, extent, freeze-up and break-up
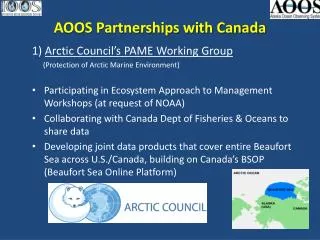
AOOS Strategy: Statewide + 3 Regions • Statewide - Provide data management, access, visualization, model domains - Integrate obs that cross agency missions & disciplines - Fill in gaps in national obs assets • Arctic - sea ice forecasts & real time sea ice movement - ocean circulation patterns - climate change indicators - improved weather forecasts – winds & waves - coastal erosion prediction - marine mammal tracking • Bering Sea/Aleutian Islands - Above plus fisheries/ecosystem productivity – climate change • Gulf of Alaska - Above plus nowcast/forecasts forsearch & rescue & oil spill response - HAB forecasts
Data, Modeling & Analysis Group • Data management & integration • Web design • Data mining & analysis • Model validation & assessment • Satellite imagery reconfiguration • Data & metadata discovery • GIS dataset discovery & development • In-state biological & physical oceanography modeling capacity
AOOS Datasets • All real-time and near real-time data • NDBC buoys, tide gauges, river gauges, met stations • Routine surveys • Satellite Data • QuikScat Level 3 (JPL/PO.DAAC) • Sea Surface Temperature (NASA/GSFC/Modis) • Ocean Color Chlorophyll (NASA/GSFC/Modis) • Modis, bathymetry, topography (GINA) • Sea Ice Concentration using AMSR-E/Aqua Daily L3 12.5 km (NSIDC) • Model data • Daily RAMS forecast for Price William Sound Region • Grid #3 (Alaska Experimental Forecast Facility AEFF@UAA) • Nine international ice models for comparison through AOMIP • Historical • Prince William Sound Science Center (PWSSC) • CTD, (moorings soon), and weather station data • Institute of Marine Sciences (IMS) • XBT/STD/CTD • Current Meter Moorings • Zooplankton, Chlorophyll, Nutrients, other biological data • Bathymetry (OSRI/DNR/PWSSC)
Modeling and Analysis Group Regional Ocean Modeling System (ROMS) 50 km grid 12 km grid 3 km grid Nested domains 1 km grid