Download
1 / 35
710 likes | 1.65k Vues
Graphs with SPSS . Aravinda Guntupalli. Bar charts. Bar Charts are used for graphical representation of Nominal and Ordinal data Height of the bar is proportional to the number of values in the category. Select the icon for the chart type you want, and select the option under Data.

E N D
Graphs with SPSS Aravinda Guntupalli
Bar charts • Bar Charts are used for graphical representation of Nominal and Ordinal data • Height of the bar is proportional to the number of values in the category. • Select the icon for the chart type you want, and select the option under Data. • You can either show group of cases or groups of variables using bar chart.
Summaries for Groups of Cases • Categories of a single variable are summarized. • Bar height is determined by the Bars Represent option. • Example: To see number of males and females from the Gender variable
How to? • From the menus, choose:Graphs, Bar • Select the icon for Simple and select Summaries for groups of cases. • Select Define. • Select a variable for the category axis and move it into the Category Axis box. This variable may be numeric, string, or long string.
Summaries of groups of variables • Two or more variables are summarized within categories of another variable. • Two or more Bars Represent variables (Var 1, Var 2). • For example bar chart for gender and SES variables.
Clustered Bar chart (a) For Numeric variable
How to? • From the menus, choose:GraphsandBar • Select the icon for Clustered and select Summaries of separate variables. • Select Define. • Select at least two variables and move them into the Bars Represent box. These variables must be numeric. • Select a category variable and move it into the Category Axis box. This variable may be numeric, string or long string.
How to? • From the menus, choose:GraphsandBar • Select the icon for Clustered and select Summaries of groups of cases. • Select Define. • Select at least two variables and move them into the Bars Represent box. • These variables can be categorical.
Pie Diagram • The Pie Chart is an alternative to the Bar Chart for Nominal and Ordinal data. • The proportion of the Pie represents the category’s percentage in the population or sample. • Must identify slices.
How to make pie diagram? • From the menus, choose: Graphs and Pie • Select Summaries for groups of cases. • Select Define. • Select a variable and move it into the Define Slices by box. This variable may be numeric, string, or long string.
Boxplot • A boxplot consists of box and 2 tails. • The horizontal line inside the box tells the position of the median and its upper and lower boundaries are its upper and lower quartiles. • The tails run to the most extreme values. • boxplot in sum shows structure of the data along with its skewness and spread.
Drawing a boxplot. Question: We have recorded the heights in cm of boys in a class as shown below. We will draw a boxplot for this data. Q2 Qu QL 137, 148, 155, 158, 165, 166, 166, 171, 171, 173, 175, 180, 184, 186, 186 Upper Quartile = 180 Lower Quartile = 158 Median = 171 130 140 150 160 170 180 cm 190
How to make a boxplot? • From the menus, choose: Graphs and Boxplot • Select the icon for Simple and select Summaries for groups of cases. • Select Define. • Select the variable for which you want boxplots, and move it into the Variable box. • Select a variable for the category axis and move it into the Category Axis box. This variable may be numeric, string, or long string.
Histogram A Histogram is a graphical representation of a frequency distribution for continuous data. The height is proportional to the frequency of that class
How to make histogram? • From the menus, choose: Graphs and Histogram • Select a numeric variable for Variable in the Histogram dialog. • Select Display normal curve to display a normal curve on the histogram.
Skewness Negatively skewed Positively skewed
Number of modal classes • A modal class is the one with the largest number of observations. The modal class A unimodal histogram
Number of modal classes A modal class A modal class A bimodal histogram
Bell shaped histogram Many Statistical techniques require normal distribution. Histogram helps verify the shape of population.
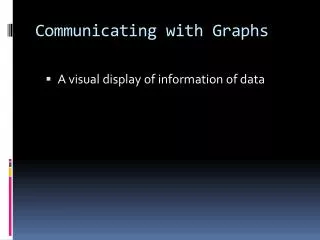
Scatter plot (1) • To know the relationships between two quantitative variables we are interested in we can use scatter plots. • A scatter diagram plots the value of one economic variable against the value of another variable. • It can be used to reveal whether a relationship exists and the type of relationship that exists. • A scatter plot can describe the relation between reading and writing scores.
Typical Patterns Negative linear relationship Positive linear relationship No relationship Negative nonlinear relationship Nonlinear (concave) relationship
How to make scatter plots? • From the menus, choose: Graphs and Scatter • Select the icon for Simple. • Select Define. • You must select a variable for the Y-axis and a variable for the X-axis. These variables must be numeric, but should not be in date format. • You can select a variable and move it into the Set Markers by box. This variable may be numeric or string.
P-P plots • Plots a variable’s cumulative proportions against the cumulative proportions of any of a number of test distributions. • Probability plots are generally used to determine whether the distribution of a variable matches a given distribution. • If the selected variable matches the test distribution, the points cluster around a straight line.
How to make P-P plots? • From the menus, choose: Graphs and P-P • Select one or more numeric variables and move them onto the Variables list. • Select a test distribution.
Q_Q plots • Plots the quantiles of a variable's distribution against the quantiles of any of a number of test distributions. • Probability plots are generally used to determine whether the distribution of a variable matches a given distribution. • If the selected variable matches the test distribution, the points cluster around a straight line.
How to make Q-Q plots? • From the menus, choose: Graphs and Q_Q • Select one or more numeric variables and move them onto the Variables list. • Select a test distribution.
Thank You Wish you colorful time making graphs