Download
1 / 6
60 likes | 162 Vues
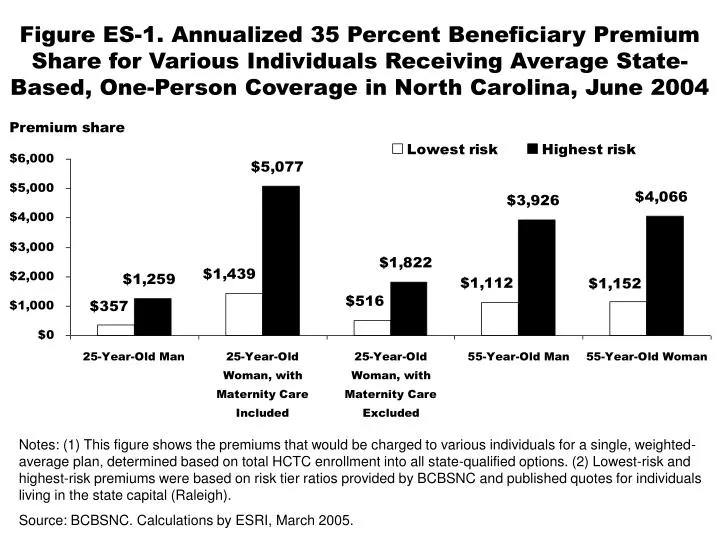
Figure ES-1. Annualized 35 Percent Beneficiary Premium Share for Various Individuals Receiving Average State-Based, One-Person Coverage in North Carolina, June 2004. Premium share.

E N D
Figure ES-1. Annualized 35 Percent Beneficiary Premium Share for Various Individuals Receiving Average State-Based, One-Person Coverage in North Carolina, June 2004 Premium share Notes: (1) This figure shows the premiums that would be charged to various individuals for a single, weighted-average plan, determined based on total HCTC enrollment into all state-qualified options. (2) Lowest-risk and highest-risk premiums were based on risk tier ratios provided by BCBSNC and published quotes for individuals living in the state capital (Raleigh). Source: BCBSNC. Calculations by ESRI, March 2005.
Figure 1. Advance-Payment Enrollment,Case Study States vs. Other States, September 2004 Percent of potential eligibles who were enrolled in advance payment Notes: (1) Potential eligibles are individuals who were identified by state workforce agencies (SWAs) or PBGCas potentially qualifying for HCTC and to whom the Internal Revenue Service (IRS) mailed HCTC Program Kits.(2) Because of concerns about confidentiality, the IRS reported enrollment numbers for Maryland and NorthCarolina that were from 1 to 9 enrollees short of the actual number. The percentages listed here represent themidpoints of these ranges. Source: HCTC Program, Monthly Executive Scorecard, September 2004, October 13, 2004. Calculations byESRI, November 2004.
Figure 2. Basis for HCTC Eligibility,Case Study States vs. Other States, September 2004 Percent of HCTC eligibles, by basis of eligibility Notes: (1) This figure portrays the basis of eligibility for individuals who were identified by SWAs or PBGC aspotentially qualifying for HCTC and to whom IRS mailed HCTC Program Kits. (2) TAA eligibility includes receiptof TAA income support, eligibility for such support but for receipt of unemployment insurance, and receipt ofAlternative Trade Adjustment Assistance (ATAA) provided to certain older, displaced workers. Sources: HCTC Program, Monthly Executive Scorecard, September 2004, October 13, 2004. Calculations byESRI, November 2004.
Figure 3. Advance-Payment Enrollment into Types of Qualified Coverage, Case Study States vs. Other States with State-Qualified Plans, September 2004 Percent of advance payment enrollees using coverage type Notes: (1) Prior Nongroup refers to automatically qualified nongroup coverage that beneficiaries received duringat least their final 30 days before job loss or other qualifying event. (2) Because of concerns about confidentiality,the IRS reported that from 1 to 9 individuals were enrolled in prior nongroup coverage in Maryland and NorthCarolina. The percentages listed here represent the midpoints of each range. (3) Other States includes onlystates that, in September 2004, offered HCTC beneficiaries state-qualified plans (aside from mini-COBRA plansoffered by small firms to former employees, under state law). Sources: HCTC Program, Monthly Executive Scorecard, September 2004, October 13, 2004. Calculations by ESRI, November 2004.
Figure 4. Annualized 35 Percent Beneficiary Premium Share for Various Individuals Receiving Average State-Based, One-Person Coverage in Maryland, June 2004 Premium share Notes: (1) The average MHIP premium was based on premiums for each age group and plan, weighted basedon total HCTC enrollment into both MHIP plans. (2) Only one CareFirst plan was offered to HCTC beneficiaries.The premium amounts for each age and risk combination were provided by CareFirst. Sources: MHIP, CareFirst. Calculations by ESRI, March 2005.
Figure 5. Annualized 35 Percent Beneficiary Premium Share for Various Individuals Receiving Average State-Based, One-Person Coverage in North Carolina, June 2004 Premium share Notes: (1) This figure shows the premiums that would be charged to various individuals for a single, weighted-average plan, determined based on total HCTC enrollment into all state-qualified options. (2) Lowest-risk and highest-risk premiums were based on risk tier ratios provided by BCBSNC and published quotes for individuals living in the state capital (Raleigh). Source: BCBSNC. Calculations by ESRI, March 2005.