Download
1 / 16
160 likes | 267 Vues
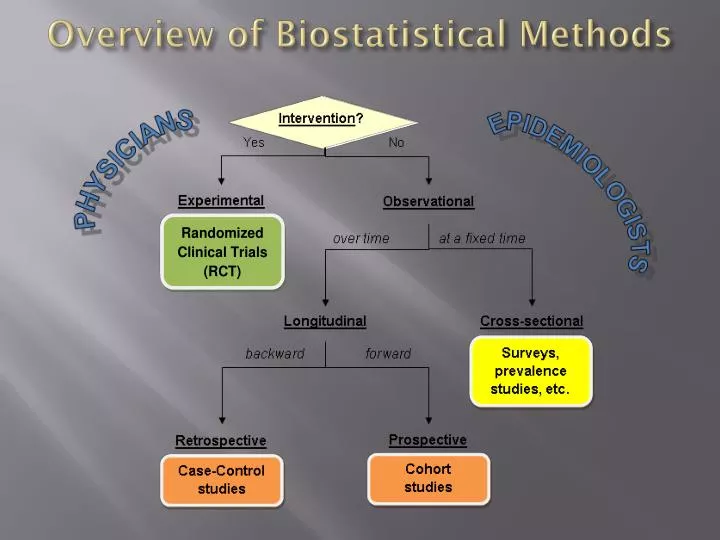
Overview of Biostatistical Methods. Overview of Biostatistical Methods. ~ GOLD STANDARD ~ Designed to compare two or more treatment groups for a statistically significant difference between them – i.e., beyond random chance – often measured via a “ p-value ” (e.g., p < .05).

E N D
Overview of Biostatistical Methods ~ GOLD STANDARD ~ Designed to compare two or more treatment groups for a statistically significantdifference between them – i.e., beyond random chance – often measured via a “p-value” (e.g., p < .05). Examples: Drug vs. Placebo, Drugs vs. Surgery, New Txvs. Standard Tx • Let X = cholesterol level (mg/dL); possible expected distributions: Treatment population Control population RANDOMIZE Treatment Arm Experiment End of Study T-test F-test (ANOVA) Patients satisfying inclusion criteria RANDOM SAMPLES X 0 significant? Control Arm
Overview of Biostatistical Methods ~ GOLD STANDARD ~ Designed to compare two or more treatment groups for a statistically significantdifference between them – i.e., beyond random chance – often measured via a “p-value” (e.g., p < .05). Examples: Drug vs. Placebo, Drugs vs. Surgery, New Txvs. Standard Tx • Let X = cholesterol level (mg/dL) from baseline, on same patients Post-Tx population Pre-Tx population Pre-Tx Arm Experiment End of Study Paired T-test, ANOVA F-test “repeated measures” Patients satisfying inclusion criteria PAIRED SAMPLES X significant? Post-Tx Arm 0
Overview of Biostatistical Methods ~ GOLD STANDARD ~ Designed to compare two or more treatment groups for a statistically significantdifference between them – i.e., beyond random chance – often measured via a “p-value” (e.g., p < .05). Examples: Drug vs. Placebo, Drugs vs. Surgery, New Txvs. Standard Tx • Let T = Survival time (months); population survival curves: survival probability Kaplan-Meier estimates S(t) = P(T > t) End of Study Log-Rank Test, Cox Proportional Hazards Model AUC difference 1 significant? S1(t) Treatment S2(t) Control T 0
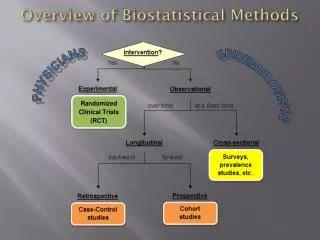
Overview of Biostatistical Methods Cohort studies Case-Control studies
Overview of Biostatistical Methods Observational study designs that test for a statistically significantassociation between a disease D and exposure E to a potential risk (or protective) factor, measured via “odds ratio,” “relative risk,” etc. Lung cancer / Smoking Case-Control studies Cohort studies PRESENT cases controls reference group E+ vs. E– ? D+ vs. D– E+ vs. E– D+ vs. D– ? PAST • relatively easy and inexpensive • subject to faulty records, “recall bias” • measures direct effect of E on D • expensive, extremely lengthy… • Example: Framingham, MA study FUTURE Both types of study yield a 22 “contingency table” for binary variables D and E: where a, b, c, d are the observed counts of individuals in each cell. End of Study Chi-squared Test McNemar Test (for paired case-control study designs) H0: No association between D and E.
Overview of Biostatistical Methods As seen, testing for association between categorical variables – such as disease D and exposure E – can generally be done via a Chi-squared Test. But what if the two variables – say, X and Y – are numericalmeasurements? Furthermore, if sample data does suggest that one exists, what is the nature of that association, and how can it be quantified, or modeled via Y = f(X)? Y Correlation Coefficient measures the strength of linear association between X and Y JAMA. 2003;290:1486-1493 Scatterplot –1 0 +1 r negative linear correlation positive linear correlation X
Overview of Biostatistical Methods As seen, testing for association between categorical variables – such as disease D and exposure E – can generally be done via a Chi-squared Test. But what if the two variables – say, X and Y – are numericalmeasurements? Furthermore, if sample data does suggest that one exists, what is the nature of that association, and how can it be quantified, or modeled via Y = f(X)? Y Correlation Coefficient measures the strength of linear association between X and Y JAMA. 2003;290:1486-1493 Scatterplot –1 0 +1 r negative linear correlation positive linear correlation X
Overview of Biostatistical Methods As seen, testing for association between categorical variables – such as disease D and exposure E – can generally be done via a Chi-squared Test. But what if the two variables – say, X and Y – are numericalmeasurements? Furthermore, if sample data does suggest that one exists, what is the nature of that association, and how can it be quantified, or modeled via Y = f(X)? Y Correlation Coefficient measures the strength of linearassociation between X and Y JAMA. 2003;290:1486-1493 Scatterplot –1 0 +1 r negative linear correlation positive linear correlation X
Overview of Biostatistical Methods As seen, testing for association between categorical variables – such as disease D and exposure E – can generally be done via a Chi-squared Test. But what if the two variables – say, X and Y – are numericalmeasurements? Furthermore, if sample data does suggest that one exists, what is the nature of that association, and how can it be quantified, or modeled via Y = f(X)? Correlation Coefficient measures the strength of linearassociation between X and Y For this example, r = –0.387 (weak, negative linear correl)
Overview of Biostatistical Methods As seen, testing for association between categorical variables – such as disease D and exposure E – can generally be done via a Chi-squared Test. But what if the two variables – say, X and Y – are numericalmeasurements? Furthermore, if sample data does suggest that one exists, what is the nature of that association, and how can it be quantified, or modeled via Y = f(X)? Regression Methods Simple Linear Regression gives the “best” line that fits the data. ? residuals Want the unique line that minimizes the sum of the squared residuals. For this example, r = –0.387 (weak, negative linear correl)
Overview of Biostatistical Methods As seen, testing for association between categorical variables – such as disease D and exposure E – can generally be done via a Chi-squared Test. But what if the two variables – say, X and Y – are numericalmeasurements? Furthermore, if sample data does suggest that one exists, what is the nature of that association, and how can it be quantified, or modeled via Y = f(X)? Regression Methods Simple Linear Regression gives the “least squares”regression line. residuals Want the unique line that minimizes the sum of the squared residuals. For this example, r = –0.387 (weak, negative linear correl) Y = 8.790 – 4.733X (p = .0055) For this example, r = –0.387 (weak, negative linear correl) It can also be shown that the proportion of total variabilityin the data that is accounted for by the line is equal to r2, which in this case, = (–0.387)2 = 0.1497 (15%)... very small.
Overview of Biostatistical Methods • Extensions of Simple Linear Regression • Polynomial Regression – predictors X, X2, X3,… • Multilinear Regression – independent predictors X1, X2,… • w/o or w/ interaction (e.g., X5 X8) • Logistic Regression – binaryresponseY (= 0 or 1) • Transformations of data, e.g., semi-log, log-log,… • Generalized Linear Models • Nonlinear Models • many more…
Numerical (Quantitative)e.g., $ Annual Income Summary ~ 2 POPULATIONS: Independent e.g., RCT Paired (Matched) e.g., Pre- vs. Post- σ1 σ2 X H0: 1 = 2 1 2 Sample 1 Sample 2 No Yes Yes No Normally distributed? • Q-Q plots • Shapiro-Wilk • Anderson-Darling • others… Yes No Yes No Equivariance? “Nonparametric Tests” • F-test • Bartlett • others… “Nonparametric Tests” Wilcoxon Rank Sum (aka Mann-Whitney U) “Approximate” T • Sign Test • Wilcoxon • Signed Rank 2-sample T (w/o pooling) 2-sample T (w/ pooling) • Satterwaithe • Welch Paired T 2 POPULATIONS: ANOVA F-test (w/ “repeated measures” or “blocking”) • Friedman • Kendall’s W • others… Kruskal-Wallis • ANOVA F-test • Regression Methods Various modifications
Categorical (Qualitative) e.g., Income Level: Low, Mid, High Summary ~ 2 CATEGORIES per each of two variables: H0: “There is no association between (the categories of) I and (the categories of) J.” r × c contingency table Chi-squared Tests • Test of Independence • (1 population, 2 categorical variables) • Test of Homogeneity • (2 populations, 1 categorical variable) • “Goodness-of-Fit” Test • (1 population, 1 categorical variable) • Modifications • McNemar Test for paired • 2 × 2 categorical data, to control • for “confounding variables” • e.g., case-control studies • Fisher’s Exact Test for small • “expected values” (< 5) to avoid • possible “spurious significance”
Introduction to Basic Statistical Methods Part 1: Statistics in a Nutshell UWHC Scholarly Forum May 21, 2014 Ismor Fischer, Ph.D. UW Dept of Statistics ifischer@wisc.edu Part 2: Overview of Biostatistics: “Which Test Do I Use??” • Sincere thanks to… • Judith Payne • Heidi Miller • Samantha Goodrich • Troy Lawrence • YOU! All slides posted at http://www.stat.wisc.edu/~ifischer/Intro_Stat/UWHC