Download
1 / 14
140 likes | 224 Vues
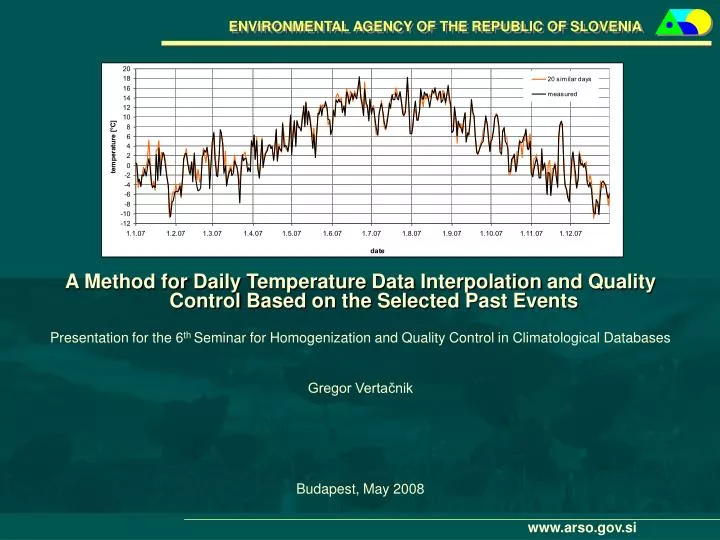
A Method for D aily T emperature D ata I nterpolation and Q uality C ontrol B ased on the S elected P ast E vents Presentation for the 6 th Seminar for Homogenization and Quality Control in Climatological Databases Gregor Vertačnik Budapest, May 2008. Overview. Purpose

E N D
A Methodfor Daily Temperature Data Interpolationand Quality Control Basedonthe Selected Past Events Presentation for the 6th Seminar for Homogenization and Quality Control in Climatological Databases Gregor Vertačnik Budapest, May 2008
Overview • Purpose • Description • The selection of similar days • Interpolation • Examples • Issues and disadvantages • Conclusion
Purpose • Missing data interpolation and quality control of daily air temperature series at climatological stations (T7, T14, T21, Tmin, Tmax) • In simple methods (e.g. with monthly correction factors) the same climate statistics regardless the weather type at given day is used • Typical temperature diurnal ranges and spatial patterns in complex terrain (Slovenia): • Northeasterly föhn wind, Bora (warm and windy littoral, cold interior) • Temperature inversion in valleys and basins (colder nights, fog, larger/smaller diurnal range) • Aim of a new method: the use of climate statistics for the corresponding weather type • Interpolation improvement: • Reduction of interpolation error (standard deviation) • Better mean values for longer periods (month)
Climatological stations in the complex terrain of northwestern Slovenia, 1980: mountain-, plateau-, slope-, valley/basin-stations
An example of strong horizontal temperature (Tmax, yellow) gradient due to daily precipitation gradient (blue), August 29, 2003 (Val Canale flood). Stations below 1000 m are marked by a red circle.
Description • Temperature interpolation at the target station on the chosen (target) day • Two-step method: • Selection of the most similar days to the interpolated one • Interpolation • Use of temperature ranges and the spatial pattern: • Measurements before/after and at the interpolation time (e.g. for Tmin, T21 the day before, Tmin, T7, T14) • User-defined or the best-correlated nearby stations
The selection of similar days • Minimum weighted Euclidean distance • Input: temperature data at reference stations at the target and a similar day • Weights based on Pearson correlation coefficient • Two types of similarity: • Range and spatial pattern (weather phenomena) • Absolute values (air mass) Temperature time series on Rudno polje (Pokljuka) 18-19 July, 2007 (T0) and arbitrary similar series (T1, T2)
Basic weights: • Normalized (standardized) average temperature deviation of a similar day from the target day: • Normalized (standardized) weighted Euclidean distance between a similar and the target day:
Interpolation • Basis: mean differences between the values of the reference variable at a reference station and the interpolated variable at the target station in the set of similar days • Temperature estimation for each reference station • Weighted mean of estimations • Corrected for the number of days with the data An example of temp. estimatations at the reference stations, the final result and the measured value (in brackets)
Examples • Minimum temperature in Portorož 2006-2007: • Reference stations: • Bilje • Bilje, Postojna • Reference variable: Tmin • Var. for the selection of simil. days: • Tmin • Tmin, T21_y, T14 • T14_y, T21_y, T7, Tmin, T14, Tmax • 30 similar days • Reference period: 1991-2005 • p1=1, p2=1, p3=2,kdev=0.5 Standard deviation of the error in °C (Bilje + monthly correct. 1.80, Postojna + monthly correct. 2.35) Topography in western Slovenia with marked station locations
Minimum temperature at Ljubljana Airport, 2003-2007: • 5 reference stations (highest correlation) • Reference variable: minimum temperature • Reference period: 1995-2002 • Var. for the selection of similar days: T21 (the day before), T7, Tmin, T14, Tmax • p1=1, p2=1, p3=2,kdev=0.97 Standard deviation depending on the value of kdev Standard deviation of the error series Result comparison, March 2004
Issues and disadvantages • The choice of the weighting factors (depend on variables, stations) • How many days to select and variables to include? • Homogenous series strongly prefered! (possible solution iterative process?) • Time consuming • Sometimes impossible to infer on local phenomena (lack of stations): • wind (e.g. Karavanke föhn) • valley/basin fog • showers and thunderstorms the reason for a large part of the variance remained unexplained (other meteorological variables and data at the target station should be included)
Conclusion • Lower interpolation error compared to the most simple method (monthly correction factors) • More stations and variables for the selection of similar days usually improve interpolation results • The method is unable to recognize some local weather phenomena → other meteorological variables should be included • Optimal parameter values vary from case to case • Homogenous series strongly prefered!