Download
1 / 51
510 likes | 663 Vues
Software Metrics. Static metrics - Function point & calculate function points 、 FP 與 S/W science 、 Feature points 、 Cyclomatic complexity 、 Dataflow metric 、 Structural metric 、 Relative metric 、 Complexity over time Dynamic metrics – Runtime complexity

E N D
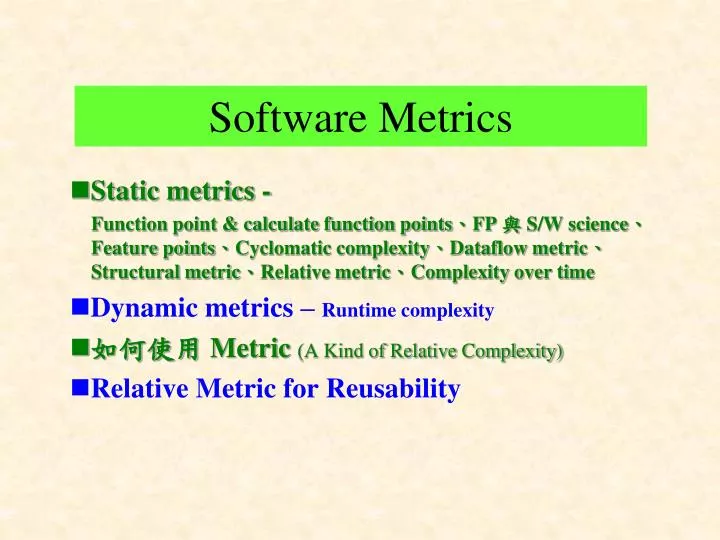
Software Metrics Static metrics - Function point & calculate function points、FP 與 S/W science、Feature points、Cyclomatic complexity、Dataflow metric、Structural metric、Relative metric、Complexity over time Dynamic metrics – Runtime complexity 如何使用 Metric (A Kind of Relative Complexity) Relative Metric for Reusability
STATIC METRICS Span Between data reference, Eg. 抓取data之#of Comparison , #of call, #of read... Slicing:E.g. external output有關之 Code length Data Biding:E.g. #of Common Block Var’s. Data Organization metrics Halstead S/W science #of Source line of code Volume metrics Cyclometric Complexity Knots Count : #of Control Intersection pts Scope metric : 每個statement之影嚮範圍 Logical Complexity:E.g. #of Binary decision (Absolute logical complexity); #of Binary decision / #of statement (不含comment, relative logical complexity) Average Nesting level MEBOW - 在Flow Chart上,有branch的地方放上weight(1), 算weight sum而得與knot差不多 Call Statement之總數 Control metrics 還有 Data flow metrics Structure Metrics Entropy - Based Metrics Syntatic Complexity Family H.F. Li;W.K. Cheung Hybrid metrics 2 兼有control與volume特性
Halstead’s S/W Science *參數定義 ** n1 : 不同operator之總數 - 基本算術及 logic 運算元 如 +,-,*,/,(),=,>,<,.OR.,.... - Keyword (RESERVE Word) - Subroutine name, Procedure name,.... ** n2 : 不同 operand之總數 - 所有 Variables - 所有 Constants - 所有 .TRUE, .FALSE. ** N1 : 用operator 之總次數 ** N2 : 用operand 之總次數 ** n : #of Vocabulary (n1 + n2) ** N : Program Length (N1 + N2) ** V : Program Volume - #of total Bits required in memory 3
<實驗> 255個 program 通常 N < 170 , N > N N > 200, N < N Correction 0.94 ^ ^ ** L : Program Level ◎主要指 Language description power。(syntatic power). ** IC : Intelligence Content ◎指Program由一種Language 轉換成另一種 Language後不變的那一部份。 ** D : Program Difficulty ◎指implement 一個Algorithm之難易程度。通常與 L有關,L愈低D就愈高。 ** E : Program Effort ◎製作一個Program 所需之 Effort 。 * Estimation formula ** Estimation of Program Length (N) N = n1lg(n1) + n2lg(n2) Assembly view ◎N主要被拿來 estimate L.O.C ( Source Code ) ,不含Comments 。 E.g. N = 17lg17 + 15lg15 = 128.09 N = 113 ^ ^ ^ ^ 4
LINE LABEL STMT NOE 1 0 0 $JOB WATFOR 2 0 0 C 3 0 0 CPROGRAM TO FIND THE ROOT OF THE EQUATION X ** X = 10 4 0 0 C INTERATION 5 0 0 C 6 0 0 C CHAN CHI HUNG 7 0 0 C EI 8 0 0 C 9 0 1 1 READ, X, E, O 10 0 2 1 IF ( X.LT.0 ) GOTO 20 11 0 3 2 I = 1 12 10 4 3 10 Z = X ** X * (ALOG (X) + 1 ) 13 0 5 3 IF ( ABS(Z) .LT. D) GOTO 30 14 0 6 4 Y = X - ( X ** X - 10 ) / Z 15 0 7 4 IF ( Y.LT. O) GOTO 40 16 0 8 5 I = I + 1 17 0 9 5 IF ( ABS ( X - Y ) .LT .E ) GOTO 60 18 0 10 6 IF ( I .GT. 30 ) GOTO 50 19 0 11 7 X = Y 20 0 12 7 GOTO 10 21 20 13 8 20 PRINT, ‘Initial guess small than zero’ 22 0 14 8 GOTO 70 23 30 15 9 30 PRINT, ‘Derivation of the function vanishes’ 24 0 15 9 A, Newton - Raphson interation invalid’ 25 0 16 9 GOTO 70 26 40 17 10 40 PRINT, ‘Invalid initial guess, next approx’ 27 0 18 10 GOTO 70 28 50 19 11 50 PRINT, ‘Number of interations exceeds 30 29 0 19 11 A, guess’ 30 0 20 11 GOTO 70 31 60 21 12 60 WRITE (6,80) Y 32 80 0 80 FORMAT (11X, ‘Root of equation = ‘, E15.6) 33 70 22 13 70 STOP 34 0 23 14 END 35 0 0 $DATA 5
n1 = 17 OPERATORS ---------------------------------------- READ 1 EOS 21 IF 5 ( ) 10 .LT. 4 GOTO 10 = 5 ** 2 * 1 ALOG 1 + 2 ABS 2 - 3 / 1 .GT. 1 PRINT 4 WRITE 1 ---------------------------------------- TOTAL N1=74 n2 = 15 OPERAANDS ------------------------------------------ X 9 0 2 20 1 I 4 1 3 Z 3 D 1 30 2 Y 4 10 2 40 1 E 1 60 1 50 1 70 4 ------------------------------------------ TOTAL N2 = 39 6
^ 如果以N來估計 L.O.C. Correlation約0.8 E.g. LOC = 23 N = 128 愈小的program愈不準,愈大的則較準,但均必需乘上一些調整因子。 *不要估算一個program,去估計整個S/W會好一些,但會碰到n1與n2不好尋得之問題。Function pts試圖解決此一問題... *Program volume Estimation V = Nlgn 例子:V = 113lg32 = 565 - 最小可能之Volume Estimation (Potential Volume ) V* = N* lgn* n* = n1* + n2* V* 之lower bound Executable Code Size 假設Operator均為“Built-in”則n2*幾乎Dominate V* 因為n1*只有Program name 與( )即2 N2* log2n2* V* (例子) V* =(2+N2) log2(2+N2) = 17(log217) ≈ 68 (bytes) 可能的Volume 可用於早期(S/W life cycle)之Size估計. 所以所謂n*即表示SS or SRS中估算而來之I/O 與Process特性. 7
◎Program Level之估算 L= 最High Level之Language Built-in every thing to be operated 所以 L = 1。Level愈低表示language level愈低 - How to estimate L L = 刻意迴避N1,因為它關係到detailed Program logic ** Halstead 認為 L 與 L 之 Correlation 約 0.9 ** 有人用FORTRAN 之 Program 去 estimate L 與 L 之 Correlation為 0.531。 表示一個 Project中Engineer的功力亦將影嚮 L 之值。 ◎Program Difficulty 之估算 D D = D = = D = = 22.1 當Program Size大時, n1對 D 之影嚮不明顯, 主要之factor 是程式大時data將嚴重影嚮程式之難易程度, (Operand之平均使用次數) ,所以OOD是一個自然的反應與趨勢。 V* V 2n2 n1N2 ^ ^ ^ ^ n1N2 2n2 17*39 2*15 1 L 1 L ^ ^ ^ N2 n2 8
* V * = = = IC LV × V V V V L * n1N2 Nlog2n 2 n2 V L ^ ^ n1N2 Nlog2n 2 n2 17×39×128log232 2 ×15 * Intelligence Context (IC) * Program Effort E E = = DV Halstead 認為當 language level很高時implement effort 則降低 估計 E = = 例子 = 14153.9 S/W Science 可能忽略了人為之影嚮。 例如Effort 與人之能力與經驗,有很高的關係! ^ 9
Function Point * 什麼是 F.P. ? 把 SS or SRS中之Capability分類,分為5種 Function Types ,分別估計其 F.P. 依 Processing Complexity調整所有估計值 算出 Total F.P. * 五種Function Types 1. External Input Types 2. External Output Types 3. Logical Internal File Types 4. External Interface File Types 5. External Inquiry Types 10
* EXTERNAL INPUT TYPES (transactions input from users or other applications) ** Input data item → “G-value” from INS。 ** User key in → “ User’s name “。 ** Update logical internal file type 中之 data ( 一個 action) → “ Update Access right table” 。 Note : - 不同 format之同一input (content一樣),不論出現次數均 “ count 1” 。 - 有些 inputs format相同,只要 Processing logic不同就視為不同之inputs。 ** External Inputs可區分為三種 Complexity module。 - Simple:․沒有太多single data item。 ․沒有太多update logical internal file 之input。 ․沒有太多human factor request。 - Complex:Simple的相反。 - Average:搞不清楚Simple或Complex。 Note : - 不要把額外之input加上, (如為Testing方便所設者) 。 - 別把record file input算進去,因它屬於“external interface file”。 11
* EXTERNAL OUTPUT TYPES (transactions output to users or other applications) ** Single output data item or message report ** Control → “ Launch” Note :同 External input Type ** 三個 complexity level - Simple : 一兩個field 之 data elements. - Complex : 此一output 將成為許多或複雜之檔案處理動作的reference - Average : 好幾個field 之 data elements。 Note : **不要把 output file算進去,因它屬於External Interface file。 **不要把 External response (即針對External inquiry response 算進去,因 它屬於 External inquiry type,即data從database取得。) * Logical Internal file Type ** 對User 而言,一組具有邏輯意義之 data file , 這些 file 可能由 system產生、使用 or maintain。如 Access right table for DBMS。 ** 三個 Complexity level - Simple : record type 不多,data type不多,沒有特殊performance 需求及 recover之需求。 - Complex : Simple的相反。 - Average : 搞不清是 Simple or Complex 。 12
* EXTERNAL INTERFACE FILE TYPE ** 在Application 間 (不同CSCI) ,互相傳送或Shared之Data File,且分別在各Application上都得 Count 進去!如 Access Right Table For MIS。Complexity level定義與Logical external file type完全一樣。 * EXTERNAL INQUIRY TYPE (Single key search) S/W Function Input Query Query Response 如 Search key Search response Note : **相同之 Query/response Format 不論出現幾次仍是 “一個” **不論 Format如何,Processing logic不同就不是同一個。 ** Complexity Level - Query Part : 用External Input 之方法 - Output Response : 用 External Output之方法 Simple Simple Average Average Simple Average Simple Average Simple Average Complex 13
Calculate Function Points Albrecht 提出 : ( 以 IBM 經驗數據 ) (#of Inputs ×4) + (#of Output ×5) + (#of Inquiries ×4) + (#of files ×10) + (#of Interfaces ×7) = Function Points (F.P.) *為了取代S/W Science中之# of operands 或 operators,F.P.需做適當調整。 Adjusted F.P. → AFP = PCA × F.P. Processing Complexity Adjustment ◎PCA的14個特徵 : **Data Communication ( 如 LAN , WAN)、**Multiple Site、** Performance ** Distributed functions (需透過 Synchronous or asynchronous mechanisms運作的func. 如 Handshaking)、** Heavily used configuration (S/W 在很Busy的HOST上跑)、 **Transaction Rate、**Online data Entry、**Online update、 **End User Efficiency ( turnaround time)、**Installation Ease、 **Complex Processing (Application Domain不單純,如Matrix Operation、 Exception Handling等)、**Facilitate Change (指 C.M. for Capability)、 **Reusability (指使用許多運作中S/W的Components) 。 14
◎定 PCA的方法 • 14 個特徵中,給定一個 0~5的值,代表其對 Processing Complexity 之影嚮。 • 》沒有該項特徵或有也沒影嚮為 “0 ” 》 搞不清是 2 or 4 為 “3” 》影嚮不明顯 (但有) 為 “1” 》 影嚮很顯著為 “4” 》影嚮一些為 “2” 》影嚮嚴重 (尤指throughput) “5” PCA 值 range 應在 0.65 ~ 1.35間 PCA = (14個特徵值之總和) * 0.01 +0.65 AFP FP * PCA 15
FP 與 S/W Science 由於 FP 從 SS or SRS 中取得,調整後用以取代S/W Science中之# of operands & operators,因此只能算是Potential Count。通常直接拿來 estimate SLOC會差很多。所以用來estimate V*: V* = (AFP +2 ) log2(AFP +2) 如 PL/1 SLOC 6.3 (AFP +2) log2(AFP +2) + 4370 則 Correlation 是 0.997. *如把AFP直接拿來Estimate SLOC: 則 PL/1 → AFP 65 SLOC COBOL→ AFP 100 SLOC *AFP與Language及Application屬性也有關係。原來Function Point Concept,偏重於Data intensive Applications之Estimation,對scientific App.s Or embedded S/W則較無法使用。 Modify Feature Point 16
Feature Points 旨在矯正Func. Pt 無法方便的估計 real-time. Embedded, Military , System S/W 之缺點。 * Feature Point組成之參數 # of Algorithm × 3 # of Input × 4 # of Output × 5 # of Inquiries × 4 # of Data files × 7 # of Interfaces × 7 + Feature pts. *它也有 PCA. Rang 是 0.6 ~ 1.4 Function Point與Feature Point之關係 S/W 種類 Feat Pt/Func. Pt. Non Procedural 0.75 Batch 0.9 Scientific/數學 1.05 System S/W 1.1 Telecommunication 1.15 Process Control 1.2 Embedded / Real-time 1.25 Graphic / Image Processing 1.3 Robtic / Automation 1.35 A.I. 1.4 17
Nested IF CYCLOMATIC COMPLEXITY (McCabe & Gilb) * 簡言之 #of different cond’ns * 算法: 1.把Program Flow Chart畫出來 2. Cyclomatic complexity V(G) = #of edges - #of nodes + 2 當Program中沒有decision時, #of edges = #of nodes - 1 反應Control之複雜性 V(G) = -1 + 2 = 1 * 對一個Single entry - Single Exit之Program而言 V(G) = #of Single Binary decision +1, 假設有 k 個 decisions , 則 #of edges = (#of Nodes -1) + k, 所以 V(G) = (#of nodes -1) + k - #of nodes + 2 = k+1 = #of decisions +1 * Algorithmic approach 看到IF , CASE或其他 alternate execution Construct 就 +1 看到Iterative Construct 如 Do, Do - While 就 +1 對每個 k choice之CASE 就 +(k-2) ← 2k edges-(k+2) nodes = k-2 對每個IF中如有 AND 或 OR 就 +1 有問題嗎? 18
例子 Entry 1 2 8 3 1,3,4,5,6 中各有一Cond’n V(G) = 5+1 = 6 V(G) = 18 - 14 + 2 = 6 4 9 5 10 6 12 13 14 7 11 Exit ** Cyclomatic #可代表unit test之測試需求。 KNOTS Metrics * 指 Control flow 之交叉點 所以 Branch 愈多 knots 愈多 Control Complexity 愈高 19
1 Entry 1 2 2 3 8 3 4 4 5 9 5 6 10 6 12 7 14 13 7 11 8 Exit 9 10 11 10 20 IF (Cond’s) THEN GO TO 20 12 Node 1 Node 2 Node 3 Node 4 State - 1 13 State - 2 State - 3 14 Go TO 10 例子 Knots count = 23 這個Program “Go To”太多! Exer. ** 與可讀性及可維護性有關。 如果 node上,不只有一個 Statement,如 Node 3,有一個Backward branch指進去,當然指到1st Statement of Node 3,因此會與其Out branch有knots。 20
1 8 2 13 3 9 4 13 10 5 13 12 6 13 7 11 13 SCOPE METRIC [Harrison , Magel , 1981] 以衡量一個Program Node 在 Program Logic 中伴演之角色為基礎。 * Selection node - Program Graph中,那些out-degree超過 “1” 的node 稱為 “Selection node” 。 * Receiving Node - 不是Selection node 稱之。 * Greatest Lower Bound Node (GLB node) Node1是Selection node 它的Lower Bound Nodes有 8 →Scope 1 ← Scope內沒別人 2 →Scope 1 ← Scope內沒別人 3 →Scope 2 , 1← 2 在Scope內 不是→4 → Scope 3 , 7 , 6 , 5 , 4(X) 9 → Scope 3 , 7 , 6 , 5 , 4 , 3 , 2 , 1 10 與 9 同 ….. 13 → Scope 9, 3, 7, 6, 5, 4, 3, 2, 1 10, 4, 3, …… 12,…… 11, …… 8 它最大所以 Node1之GLB是13 21
1 8 2 13 3 9 4 13 10 5 13 12 6 13 7 11 13 Node 3是Selection node GLB → 9 => 3, 7, 6, 5, 4 不是 → 4 => 3, 7, 6, 5, 4(x), 3 (其實 9, 10, 12, …均可) 5 => 與 4 同 ….. 10 => 與 9 同 12 => 與 9 同 11 => 與 9 同 不是→ 13 => 9 , 7 , 6 , 5 , 4 , 3 10, 7 , 6 , 5 , 4 12, 7 , 6 , 5 , 4 因為 11, 7 , 6 , 5 , 4 out of scope 8, ~~~~~~~~~~~~~~~~~~~~~~~~~~~~~~~~~~~~~~~~~~~~~~~~~~ 例子統計 Node Scope Metric GLB 1 2,3,4,5,6,7,8,9,10,11,12 12 13 2 1 Receiving 3 4,5,6,7,3 6 9 4 4,5,6,7,3 6 10 5 4,5,6,7,3 6 12 6 4,5,6,7,3 6 11 7 1 Receiving … ... 13 1 14 0 Terminal Scope Complexity 44 22
* SCOPE RATIO 例子 : ( 1 - 13 / 44 ) * 100% = 70.45% Complexity愈高愈接近100% - Scope Metric可矯正Cyclomatic # 對Node Complexity之忽略。 - Scope 會誤判情形,Scope 很高可能是 Program 很大,而不是logical complexity 很複雜!因此 Scope ratio可平衡一下這種誤差。 #of node (terminal node不算) 23
Syntatic Complexity Family 是一種 Hybrid metrics,把因應一套軟體系統中各種不同性質之程式,組合不同之 metric。假設電腦Software S被程式 P1,P2,...,Pk所組成,則Software S的Syntatic Complexity C(S): C(S) = b × [ C ( Pi ) ] 其中b是weight,可能與nested level 有關。 *根據 Decomposition Criteria及程式性質,決定每次decompose的component是proper或non-proper. V1 if Pi Proper C(Pi) = V2 if Pi Non-proper 範例:Executable Statement Count (STMT) C(S) = b× [ C(Pi) ] 1 if Pi is a executable statement 令 b = 1 , C(Pi) = 0 if otherwise C(S) = C(P1) + [ C(Pi) ] 假設P1是executable statement則 = 1 + [C(Pi)] = … = STMT k i=1 k i=1 k i=2 k i=2 24
# of Call (CALL) b = 1, 1 if Pi是個 func. Call or proc. Call C(Pi) = 0 if otherwise C(S) = C(Pi) = CALL Cyclomatic Complexity(for single entry and single exit binary decision) b = 1, 1 if Pi是Segment C(Pi) = 0 if otherwise 所謂 Segment 就是 Segment Segment Entry statement Entry Statement … … Branch statement Terminal statement Generalized Form if P = S1 ; S2 ; …… Sk a sequence construct C(P) = b( C(S1) + C(S2) + …+C(Sk)) if P is Nested IF construct C( IF B1 THEN S1) = b(B1) C(S1) = b(B1) C(IF B2 THEN S2) = b(B1) b(B2) C(S2) = b(B1) b(B2) … b(Bk) C(Sk) ,假設Bi均為W個cond’ns之Logic expression (即為 W-1 個AND或OR之expression) 令b(Bi)與cond’n個數有關則C(Nested IF ) Wk C(Sk) Wk (Sk是single expression 所以 C(Sk)=1) k i=1 25
Data-Flow Metric Definition : Block (或Segment, Chunk ) 範例 … IF(...)THENGOTO 20 Statement S1 The only statement get control from the other block. Block S2 Sequentially (no branches). ... Sk可能是一個Branch,或是一個Common statement。 20 Sk+1 Control entry point 所以是另一個Block之開始點。 Def : Variable Definition of a statement single statement X = f function call ( X 在等號左邊) Assignment X 得到一個 definition Def : Variable Reference of a statement single statement = f(X) function call ( X 在等號右邊) Assignment Output X 被 reference 到 26
Def : Locally Available Variable of a Block X 如果在 Block B有一個 definition 則 X locally Available in B Def : Locally Exposed Variable reference in a Block X 在Block B 被 reference 到,但 X 的 definition 不是來自於 B ◎ Reach X= … Block B : X在過程中沒有redefine過,即X不locally available along the path。(Path可能empty 表示C是B的immediate successor) … = f(x) Block C : 表示B中X的definition Reach Block C 27
◎Data - Flow metric ※ Reach Set Ri -所有從外面帶進來的值。(Values count) Let V be the set of all variables in whole program. Ri = { Def set of v | variable vV which’s definition reachBlock i } ※ Locally Exposed Set -所使用的變數中,其值是在block外被定義的。(Name count) Vi= { v | variable vV which is locally exposed in Block i} ※ # of definitions of Reach set Variables in Block i DEF (vj) = ∑j# of definitions of vj , vj Vi, 且其 Definitions Ri ◎討論 ※ Ri中某個 v 的reach def. 可能有好多。因為 v 可能在不同的 Block 被 define,而在不同的時間被送入 Block i 中使用。 ※ Vi中的 v 在 Block i 中均至少被exposed一次。 Block i的 data flow complexity DFi DFi = DEF (vj) ||Vi|| j=1 28
◎圖示 ... 加起來 Block i 假如一個程式有 S 個 Blocks,則此程式之 data flow complexity 就是 DF = DFi □如果考慮 concurrent program 則data flow complexity 會變成?想想看。 ※ handshaking mechanism ※ mutual exclusion □這種定義只針對Program 內部 data flow 之 Complexity,如果考慮Program 間之data flow complexity?想想看。 S i=1 29
Value pass through C A B A B Information Flow Metric : * Def : (Global Flow) Process A 與 Process B 間有個global flow透過一個 global data structure D,而 A 把 data 送入 D (或update D),而 B 經由 D 拿去用。 A → D → B * Def : (Local Flow) Process A 與 Process B有一個 Local Flow if 滿足其中: 假設 A call B (Direct local flow) 假設 B call A,而 A return a value 給 B,return value flow為一Indirect local flow。 if C call A 又 call B,其目的只是為了從 A 中取得一個value,C 自己不用又送給B使用,則 A→ B 是個 indirect data flow 。 Value return 30
Fan-in Process A 的 Fan-in 是 : (進入 A 之 local flows ) + ( 從 global data structure 抓 data 之 flows ) Fan-Out Process A 之 Fan-out 是 : ( 從 A 出去的 local flows ) + (去 update global data structure 之 flows ) ◎一個 Process (Program) 與外界的關係就是 Fan-in 與 out。 Information Flow Complexity Length × ( Fan-in × Fan-out )2 (s/w size) ( Fan-in ×Fan-out )2 Dominate Information Flow Complexity ◎為啥長成這樣? ※ 為了衡量 maintain program 可能發生修改的程度. ※ 與 data flow 有關。 ※ 與 programmer 有關。 31
※ ( Fan-in × Fan-out ) :表示 Process A 可能造成之 I/O Combination。 ※ 在 Team Work 組織下,Programmer 間互相之 interaction。 ( Fan-in × Fan-out )( Fan-in × Fan-out) ( Fan-in × Fan-out )2依圖想想 (Fan-in × Fan-out )2 用 UNIX 中之 Procedure 做實驗,關係是 到底出了啥問題,對 unix系統 而言。 0.0057 × 4 0.0228 log(fan-in × fan-out) # of procedures changed. Y 95-38 57 = = = 0.0057 發現修改次數的可 X 104 - 10 9996.8 能關係為整合所構 y = 0.0057 x 成的tree之高度,因 所以 ( Fan-in × Fan-out )2 =10 此問題通常來自於 2 log ( fan-in × fan-out ) = 整合介面之問題。 4 log ( fan-in × fan-out ) = X 0.0228 log ( fan-in × fan-out ) (Y軸坐標) 100 90 . . % of changed 40 procedures 30 20 10 (104,95) 10 102 104 complexity 10 x 2 x 2 32
Entropy-Based Measure ◎所謂 information (消息、情報、新聞) 就是「發現你尚不知道的事情」。 ◎換句話說: 一串 message中,所有 symbol 給你surprise的程度,通通加起來就是該 message 所提供的information。 ◎以 surprise程度來定義 Information 量,可以衡量語言的表達能力。 所以一串 message中,任一symbol而言,給人「surprise」程度與其出現機率之倒數成正比。 令 Si為 message中的一個 symbol。 Pi為 Si 之出現機率 Ii 為 Si 之information 量 (通常以Bit為單位) Ii = lg ( 1 / Pi) = - lg Pi 33
當 Si出現時造成之 “震撼” (Entropy) 有多大? Pi (-lg Pi) = - Pi lg Pi ◎一串message而言,S1, S2, …, Sq, 其total entropy 就是 H= - Pi lgPi Pi = 1 ※ 當 P1, …, Pq, 只有一個 symbol 時,if 是Pk則 Pk = 1,H = 0 為最小時。 ※當 P1=P2=…= Pq時,則 Pi = 1 / q,H = lg q為最大值。 -(P1 lg P1 +... + Pq lg Pq) = -lg = -lg(1/q) 當達到最大值時,表示所有Symbol 出現機率一樣。 假設Entropy愈大,Complexity愈低。最簡單的例子,一個程式用了三個operators,而總次數是3,則每個operator只出現一次,Entropy 是 -lg 1/3 = lg 3。 q i=1 q i=1 34
◎把 Entropy 用在S/W上 定義 Pi = fi:operator i 的使用次數 N1:所有operator 使用總次數 - lg 用以評估 Error Span N Error Span = 愈大愈好,表示 error density 低 # of errors 實驗發現 Entropy 愈大 → Error Span 愈大 fi N1 fi N1 fi N1 n1 i =1 35
a a c b b c d d e e f f g g Entropy for S/W structure complexity [ Structural Entropy] 把 Program 分成 Block view (segment, chunk)。 Apply Entropy measure for a chunk. ◎ Program flow graph E.g. < G > < G’ > ◎ 1st order entropy measure : 把 a, …., g 7個 chunks 分成若干 equivalence class。 Def : 兩個 Chunk 同一class,if 該兩個 chunks (node) 之 in/out degree 一樣。 所以G 之 1st order class 為 : {a}, {b,c,e,f}, {d}, {g} G’之1st order class 為 : {a}, {b,d,e}, {c}, {f}, {g} ◎ G 之1st order entropy - [(1/7)lg(1/7) + (4/7)lg(4/7) + (1/7)lg(1/7) + (1/7)lg(1/7)] = 1.666 ◎ G’ 則1st order Entropy = 2.128 36
a a c b b c d d e e f f g g ◎有啥意義呢 ? G 與 G’ 之 Cyclomatic Complexity 均為“3” (但Structure不同),而 1st order entropy 不同,G為1.666,G’較大是2.128。所以entropy可以反應structural different。G’有NESTED if or 類似之 statement,理論上,complexity要高些!(logic),如emphasize I/O degree,發現entropy不能反應logic Complexity 。 ◎ 2nd order structured Entropy 兩個 Chunk 要 equivalent iff 它們的爸爸與兒子要一樣 所以 G 之2nd class為 {a} , {b,c}, {d}, {e,f}, {g} (1/7)lg(1/7) + (2/7)lg(2/7) + (1/7)lg(1/7) + (2/7)lg(2/7) + (1/7)lg(1/7) = (3/7)lg(1/7) + (4/7)lg(2/7) = -lg7 + 4/7 G’: {a}, {b}, {c}, {d, e}, {f}, {g} (5/7)lg(1/7) + (2/7)lg(2/7) = - lg7 + 2/7 ◎ G 之 2nd order Entropy 大 → Complexity低 ◎G’之 2nd order Entropy 小 → Complexity高 37
Relative Metric Control Halstead S/W Science Size . Cyclomatic RELATIVE . Information Content COMPLEXITY . Entropy . Modularity . . . . Data structure . . A . Hybrid . Complexity Metric Factor Domain (Classification) 38
◎如何計算 S/W 之 relative Complexity : S/W m1, m2, …, mi , 一個 S/W由許多 … S/W module組成 定義 module i 之 relative complexity : i= 1Si1 + …+ jSij +… ※Sij 為Module i 在 factor domain fj 所得之量測值,所謂 factor domain 就如 「 Control, Size, …」。 ※j為Module i 在factor domain fj所得量測值Sij 所佔之份量,稱「特徵值」。 與當初選定之metric domain與factor domain之correlation有關 i 就是 S/W 之relative complexity。 i 【j】×【Corij】= 【j】 39
Table 1 Factor Pattern for Metric Analyzer (by correlations) Metric Control Size Information content Modularity Data structure V(g) 0.951 0.114 0.181 -0.041 -0.039 Statements 0.949 0.164 0.219 -0.058 -0.036 N10.944 0.141 0.200 -0.092 -0.072 OutCalls 0.933 0.141 0.021 0..036 -0.004 MaxDepth -0.027 0.971 -0.020 -0.040 -0.042 N2 0.244 0.946 0.065 -0.058 -0.020 Size 0.371 0.908 0.034 -0.034 -0.034 MaxOrder 0.062 0.084 0.919 0.132 -0.040 MeanOrder 0.058 0.085 0.918 0.133 -0.036 BW 0.248 -0.048 0.857 -0.101 0.084 MaxLevel 0.089 -0.029 -0.161 0.764 -0.112 Outputs -0.195 -0.118 0.168 0.741 0.162 InCalls 0.001 0.024 -0.182 0.163 0.791 Inputs -0.112 -0.106 0.247 0.244 0.743 Eigenvalues 3.964 3.733 3.162 1.370 1.240 MaxLevel: The max-number of nested level BandWidth: Avalue based on McCabe's cyclomatic complexity, adjusted for the added complexity of nested Ifs instead of just the number of Ifs in the code. MaxOrder: The count of the largest number of edges from a single node in the parse tree. MaxDepth: The length of the longest branch in the tree generated by the parser. 40
Complexity Over Time m 表示 module mj第 i 個 version。 如系統有 m1, m2, ..., mn, modules 組成 第一次系統整合後 , 可改為 < m’1 , m’2, …, m’n > 隨著時間 System update Version 1 V 1 = < m’1, m’2, ………, m’n > = < 1, …, 1> V 2 = < 2, 2, 1,……, 1 > V 3 = < 2, 3, 1,……, 1 > V 4 = < 3, 3, 2,……, 2 > …... * Version i 之Relative Complexity i = j j i j 2 V3 = 1 n Vji 41
Dynamic Metric ( run time complexity) 假設 Pt1, Pt2,……., Ptn, 代表 S/W 中 modules m1, ..., mn在某一特定時間 t 裏 (一段 execution time),可能出現之機率 很類似 Working Set 的精神 ! ◎ Dynamic Complexity t = Ptj j 考慮 Configuration 不見得要 relative complexity 任何 metric 加上 Pj均可視同dynamic! t = Ptj j 但為何 relative 比較好呢? ㊣考慮 dynamic 時,在一段時間裏被使用之 module 是變化不定的,而每個 module在各個factor domain 量測值不同,然而每個 module會因功能不同而偏向某個 factor domain 的特性,因此 relative complexity 比較能顯現這種差異性。 n j=1 n j=1 Vij 42
如何使用 Metric (A Kind of Relative Complexity) ◎ Metric Classification Tree for Type X errors Data Bindings >10 6-10 0-3 4-5 - System Type Revisions Cyclomatic Complexity >12 0-12 Real-time Non-real-time >18 0-18 - + - Source Lines + - 0-150 >150 - + Figure 1. Example hypothetical metric-classification tree. There is one metric at each diamond-shaped decision node. Each decision outcome corresponds to a range of possible metric values. Leaf nodes indicate if a module is likely to have some property, such as being error-prone or containing errors in a certain class (in the figure, “+” means likely to have errors of Type X and “-” means unlikely to have errors of Type X). 43
◎如何建造 Metric Classification Tree (MCT- for interface error) 1、把要分析的對象找定,並收集經驗資料,據此把分類原則確定。 Table 1. Interface-error data Module A B C D E F G H I J K L Interface errors 3 2 10 1 2 9 1 3 6 2 3 0 Class - - +- - +- - +- - - ※根據經驗可以得到區分的標準,如Module之interface error數 超過 5 個以上才叫 “高危險群” (或陽性反應)。 2、選定基準 metrics,利用這些 metrics 對各選定之 module 計算初值 (由歷史資料中取得),如此可以取得資料如下表:File management (F) User interface (I) Process control (P) Table 2. Raw training-set data Metric Module A B C D E F G H I J K L Module function I I F I F I P P P I F F Data bindings 2 9 6 13 10 15 6 15 20 4 17 16 Design revisions 11 9 11 0 5 4 2 10 5 7 1 0 Class - - +- - +- - +- - - 44
3、依據影嚮程度將各metrics之評估值分成若干值區,以便分類。3、依據影嚮程度將各metrics之評估值分成若干值區,以便分類。 Table 3. Recoded training-set data Metric Module A B C D E F G H I J K L Module function Data bindings Design revisions Class - - + - - + - - + - - - Module function = File management(F); = User interface(I); = Process control(P) Data bindings = 0 x 7; = 8 x 14; = x 15 Design revisions = 0 x 3; = 4 x 8 ; = x 9 4、將選定之metric加以評估,決定那些metric應該擺在MCT上的那個node,原則是從root開始選,因此每次均必需選一個對 “分析對象” 區分能力最強的metric擺上去。 ※為了評估metric之分類能力,定義 “Metric-selection Function”. ※當metric選定後,它會根據Step 3中之值區(i.e., 、、 )將樣本modules (i.e. A、B、C、…) 分成若干 subsets。 45
pi pi ni ni pi+ni pi+ni pi+ni pi+ni ※令 pi與 ni分別代表第 i 個 subset 中,各module它在Table 1 所對應之 “陽性反應” 個數與 “陰性反應” 個數。我們把 metric-selection function定義成: F(pi , ni ) =- lg - lg ※F(pi, ni ) 最大值發生在 pi = ni時 ※0 F(pi, ni ) 1 ※當 F(pi, ni ) 的值愈大時,表示該 subset 所有module中為陽性反應與陰性反應之個數相同。也就是說該 subset 並沒有被分類得很好。 ※因為一個 metric會把樣本 modules (i.e., A, B, C, …)分成若干個subsets (假設分為 V個),則針對一個metric之區分力評估可列為:(必須考慮其比重) E (m, M) = wi × F(pi, ni ) 樣本集合 modules metric ** wi =(pi+ni) ÷ |m|代表subset i 之module數佔總樣本module數之比重 V i=1 46
**根據討論 E(C,M)之值愈小表示該metric的區分能力愈強。 Module Data bindings function A, C, F, H, I, C, E, A, B, B, D, E G, H, I G, J K, L K, L D, F, J Design revisions D, G, E, F, A, B, K, L I, J C, H pi pi ni ni pi+ni pi+ni pi+ni pi+ni lg lg Table 3. Recoded training-set data Metric Module A B C D E F G H I J K L Module function Data bindings Design revisions Class - - + - - + - - + - - - Module function = File management(F); = User interface(I); = Process control(P) Data bindings = 0 x 7; = 8 x 14; = x 15 Design revisions = 0 x 3; = 4 x 8 ; = x 9 Figure 4. A partial tree using data bindings as the candidate metric. The metric-selection function E ({A,B,..,L} , Data Bindings) return 0.675. Positive target class instances are underlined. Figure 3. A partial tree using module function as the candidate metric. The metric-selection function E ({A,B,..,L} , Module Function) return 0.801. Positive target class instances are underlined. 圖5 E值最小,因此 metric Design revisions之區分能力最強 ! p n total weight F(p,n) w×F(p,n) Child 1 0 4 12 .333 0.0 0.0 Child 2 2 2 12 .333 1.0 .333 Child 3 1 3 12 .333 .811 .270 Sum .603 Figure 5. A partial tree using design revision as the candidate metric. The metric-selection function E ({A,B,..,L} , Design Revisions) return 0.603. Positive target class instances are underlined.This metric is selected and its leftmost child becomes a leaf node labeled “-”. 47
Design revisions Design revisions - - Modules function A, B, C, H A, B, C, H Data bindings F, J I E F, I J E Design revisions - Data bindings Modules function + - - C A, B H Figure 6. A partial tree using module function as the candidate metric. The metric-selection function E ({E, F, I, J}, Module Function) return 0.500. Positive target class instances are underlined. Figure 7. A partial tree using data bindings as the candidate metric. The metric-selection function E ({E, F, I, J}, Data Bindings) return 0. Positive target class instances are underlined. This metric is selected, yielding three leaf nodes labeled , from left to right, “-” and “+”. Figure 8. A partial tree using module function as the candidate metric. The metric-selection function E ({A, B, C, H} , Module Function) return 0. Positive target class instances are underlined. 48
Design revisions Design revisions Design revisions >9 >9 0~3 0~3 4~8 4~8 - Data bindings Data bindings Data bindings Data bindings - - Module function Module function >15 >15 0~7 0~7 F F I I 8~14 8~14 P P - - + A, C - - - - - - B H + + + + - - 例子: Raw test-set data. Metric Module M N O Design revisions 0 7 12 Module function P I I Data bindings 3 16 9 Recoded test-set data. Metric Module M NO Design revisions Module function Data bindings Figure 9. A partial tree using data bindings as the candidate metric. The metric-selection function E ({A, B, C, H}, Data Bindings) return 0.500 Positive target class instances are underlined. For this example, the metric module function is selected (see Figure 8), and it produces three children labeled “+” and “-”. Figure 10. The completed classification tree. Figure 11. Applying the classification tree on module N. 49
*本圖整理了 MCT 建造流程 ! 50 Overview of the classification-tree methodology.