Download
1 / 5
50 likes | 157 Vues
MORTALIDAD POR NEUMONIA TOTAL PRELIMINAR COMPARATIVO AÑO 2004-2005 POR LOCALIDAD. LOCALIDAD. CASOS. < 5 AÑOS. TASA X 100000. 2004. 2005. 2004. 2005. 2004. 2005. 1. USAQUEN. 0. 4. 41832. 41.006. 0,0. 9,8. 2. CHAPINERO. 4. 1. 7700. 7.700. 52,0. 13,0. 3, SANTAFE. 4. 4.

E N D
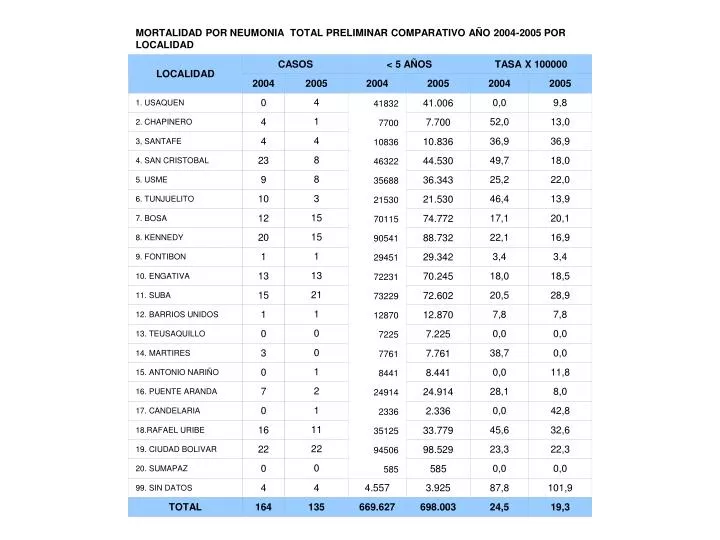
MORTALIDAD POR NEUMONIA TOTAL PRELIMINAR COMPARATIVO AÑO 2004-2005 POR LOCALIDAD LOCALIDAD CASOS < 5 AÑOS TASA X 100000 2004 2005 2004 2005 2004 2005 1. USAQUEN 0 4 41832 41.006 0,0 9,8 2. CHAPINERO 4 1 7700 7.700 52,0 13,0 3, SANTAFE 4 4 10836 10.836 36,9 36,9 4. SAN CRISTOBAL 23 8 46322 44.530 49,7 18,0 5. USME 9 8 35688 36.343 25,2 22,0 6. TUNJUELITO 10 3 21530 21.530 46,4 13,9 7. BOSA 12 15 70115 74.772 17,1 20,1 8. KENNEDY 20 15 90541 88.732 22,1 16,9 9. FONTIBON 1 1 29451 29.342 3,4 3,4 10. ENGATIVA 13 13 72231 70.245 18,0 18,5 11. SUBA 15 21 73229 72.602 20,5 28,9 12. BARRIOS UNIDOS 1 1 12870 12.870 7,8 7,8 13. TEUSAQUILLO 0 0 7225 7.225 0,0 0,0 14. MARTIRES 3 0 7761 7.761 38,7 0,0 15. ANTONIO NARIÑO 0 1 8441 8.441 0,0 11,8 16. PUENTE ARANDA 7 2 24914 24.914 28,1 8,0 17. CANDELARIA 0 1 2336 2.336 0,0 42,8 18.RAFAEL URIBE 16 11 35125 33.779 45,6 32,6 19. CIUDAD BOLIVAR 22 22 94506 98.529 23,3 22,3 20. SUMAPAZ 0 0 585 585 0,0 0,0 99. SIN DATOS 4 4 4.557 3.925 87,8 101,9 TOTAL 164 135 669.627 698.003 24,5 19,3
PRIMER TRIMESTRE MORTALIDAD ACUMULADA POR EDA COMPARATIVO 2005 2006SEGÚN LUGAR DE RESIDENCIA. LOCALIDAD CASOS < 5 AÑOS TASA ACUMULADA X 100000 2005 2006 2005 2006 2005 2006 1. USAQUEN 0 0 41.006 40.286 0,0 0,0 2. CHAPINERO 0 0 7.700 7.700 0,0 0,0 3, SANTAFE 0 0 10.836 10.836 0,0 0,0 4. SAN CRISTOBAL 1 1 44.530 43.314 2,2 2,3 5. USME 0 0 36.343 37.000 0,0 0,0 6. TUNJUELITO 0 0 21.530 21.530 0,0 0,0 7. BOSA 0 0 74.772 75.465 0,0 0,0 8. KENNEDY 0 0 88.732 87.141 0,0 0,0 9. FONTIBON 0 0 29.342 29.165 0,0 0,0 10. ENGATIVA 0 0 70.245 68.735 0,0 0,0 11. SUBA 0 0 72.602 72.228 0,0 0,0 12. BARRIOS UNIDOS 0 0 12.870 12.870 0,0 0,0 13. TEUSAQUILLO 0 0 7.225 7.225 0,0 0,0 14. MARTIRES 0 0 7.761 7.761 0,0 0,0 15. ANTONIO NARIÑO 0 0 8.441 8.441 0,0 0,0 16. PUENTE ARANDA 0 0 24.914 24.914 0,0 0,0 17. CANDELARIA 0 0 2.336 2.336 0,0 0,0 18.RAFAEL URIBE 0 0 33.779 32.749 0,0 0,0 19. CIUDAD BOLIVAR 1 0 98.529 101.522 1,0 0,0 20. SUMAPAZ 0 0 585 585 0,0 0,0 99. SIN DATOS 0 0 3.925 5.227 0,0 0,0 TOTAL 2 1 698.003 697.029 0,3 0,1