Download
1 / 30
300 likes | 410 Vues
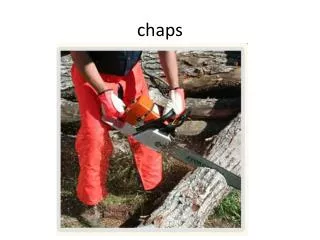
Converting Data Collected During CHAPS for Use in the PNNL Aerosol Modeling Testbed. Brody Bourque GCEP SURE Summer Intern Larry Berg, William Gustafson Jr., Jeremy Rishel Pacific Northwest National Laboratory. Overview. Define aerosols Why study?? Effects on climate

E N D
Converting Data Collected During CHAPS for Use in the PNNL Aerosol Modeling Testbed Brody Bourque GCEP SURE Summer Intern Larry Berg, William Gustafson Jr., Jeremy Rishel Pacific Northwest National Laboratory
Overview Define aerosols Why study?? Effects on climate Background on CHAPS field campaign Why focus on shallow cumuli Instruments on board aircrafts Gulfstream (G-1) NASA King Air Introduction to Aerosol Modeling Testbed (AMT) parseCHAPS program outline
Aerosols Aerosol: a collection of particles suspended in a parcel of air (ranging from nm - 30um) Why Study Aerosols???
Intergovernmental Panel on Climate Change (IPCC) - scientific body that provides the world with a clear view of the current state of climate change Cooling Effect High Level of Uncertainty http://www.ipcc.ch/organization/organization.htm
Aerosol Effects On Climate Direct effect Changes in the amount of radiation at the surface due to aerosols Semi-direct effect Changes the stability of the atmosphere (frequency of clouds) *Indirect effect Changes the amount of cloud droplets *Important for radiation and precipitation
Cumulus Humilis Aerosol Processing Study (CHAPS) Date: June 2007 Location: A series of flights (G-1 = 12 & King Air = 20) over the ACRF Southern Great Plains site and Abstract: Use in situ measurements to characterize and contrast aerosol optical & chemical properties below the shallow cumuli cloud layer (bc), in the shallow cumuli cloud layer (ic), and above the shallow cumuli cloud layer (ac) Background on CHAPS NASA King Air Battelle G-1 Gulfstream • Moderately sized city that is representative of a large number of cities around the United States Oklahoma City, OK Berg et al.
CHAPS Experimental Goals Primary Objective: To improve the understanding of effects of radiation from aerosols on climate CHAPS Study Encompasses: Clear Sky Observations *Effects of: Aerosols on Shallow Cumuli Shallow Cumuli on Aerosols *Particularly how Shallow Cumuli effect the chemical and optical properties of aerosols
Why Focus On Shallow Cumuli??? Shallow clouds play an important role in energy balance Increases amount of shortwave radiation that is reflected back into space (shortwave albedo) Not much effect on longwave radiation Poorly represented in numerical models
Instruments Aboard The Gulfstream (G-1) Two Inlets: *Counter-Flow Virtual Impactor Isokinetic Inlet Each inlet has virtually the same instrumentation *Aerosol Mass Spectrometer Size Distributions: SMPS (0.02 um - 0.44 um) FIMS (0.03 um - 0.13 um) PCASP (0.10 um - 3.00 um) CAS (0.627 um - 60.0 um) CIP (25 um - 1500 um) (>10um) (<2um) (CVI) (AMS) * ”One of few studies that have had AMS sampling downstream of CVI inlet on an aircraft…allows for the examination of chemical composition of nucleated aerosols within the cumuli”
Instruments Aboard The NASA King Air NASA High Spectral Resolution LIDAR (HSRL) Measures Profiles Between the King Air and the Surface of Aerosol: Backscatter Extinction Depolarization
Aerosol Modeling Testbed (AMT) What is it??? A computational framework that streamlines the process of testing and evaluating refined aerosol process modules over a wide range of spatial (0.1 - 100 km) and temporal (minutes - season) scales Composed of the chemistry version of the Weather Research and Forecasting Model (WRF - Chem) and various statistical and graphical programs, called the Analysis Toolkit, that allow investigators to systematically evaluate model performance
parseCHAPS Outline Create Namelist Files for each Day [Clear & Cloudy Segments] Create Output Files for all Variables with a Location File Use MILAGRO Convention All Output Files must include the Location File Location Files Use MILAGRO Convention Location File to include only in header: Year Month Day Time UTC Latitude Longitude Altitude tflag MILAGRO Naming Convention: variable_obs.txt MILAGRO Naming Convention: aircraft_yymmdd_loc.txt
Creating Namelist Files Very First Step Purpose: tells the program Created for each Day and for both Clear & Cloudy Flight Segments • how many files to read • which files to read
Creating Output Files for all Variables g1_070611_clear_loc.txt air_speed_obs.txt altitude_obs.txt ams_on_cvi_obs.txt cas_tot_a_obs.txt cas_tot_a_cloud_obs.txt cas_tot_n_obs.txt cas_tot_n_cloud_obs.txt cas_tot_v_obs.txt cas_tot_v_cloud_obs.txt ccn_obs.txt cip_tot_a_obs.txt cip_tot_n_obs.txt cip_tot_v_obs.txt cl_obs.txt co_obs.txt cvi_blue_abs_obs.txt cvi_blue_back_s_obs.txt cvi_blue_eff_s_obs.txt cvi_blue_inverted_back_s_obs.txt cvi_blue_inverted_tot_s_obs.txt cvi_blue_red_angstrom_obs.txt cvi_blue_ssa_obs.txt cvi_blue_tot_s_obs.txt cvi_cn_obs.txt cvi_enrich_fac_obs.txt cvi_flag_qc_obs.txt cvi_green_abs_obs.txt cvi_green_back_s_obs.txt • Transect Flag (tflag): • Used to partition data based on a set parameter • Parameters: • Above Cloud (ac) = 3 • In Cloud (ic) = 2 • Below Cloud (bc) = 1 Location File iso_green_eff_s_obs.txt iso_green_smooth_abs_obs.txt iso_green_ssa_obs.txt iso_green_tot_s_obs.txt iso_neph_rh_obs.txt iso_neph_ti_obs.txt iso_red_back_s_obs.txt iso_red_eff_s_obs.txt iso_red_smooth_abs_obs.txt iso_red_ssa_obs.txt iso_red_tot_s_obs.txt lapa_abs_obs.txt lapa_s_obs.txt lat_obs.txt long_obs.txt nh4_obs.txt no3_obs.txt org_obs.txt ozone_obs.txt papa_abs_obs.txt papa_s_obs.txt pcasp_int_obs.txt pcasp_tot_a_obs.txt pcasp_tot_n_obs.txt pcasp_tot_v_obs.txt potential_temperature_obs.txt pressure_obs.txt ptrms_a_pinene_frag_obs.txt ptrms_a_pinene_parent_obs.txt cvi_green_inverted_tot_s_obs.txt cvi_green_inverted_back_s_obs.txt cvi_green_ssa_obs.txt cvi_green_tot_s_obs.txt cvi_lwc_obs.txt cvi_neph_rh_obs.txt cvi_neph_ti_obs.txt cvi_red_back_s_obs.txt cvi_red_abs_obs.txt cvi_red_inverted_tot_s_obs.txt cvi_red_inverted_back_s_obs.txt cvi_red_ssa_obs.txt cvi_red_tot_s_obs.txt density_obs.txt dew_point_temperature_obs.txt fims_tot_n_obs.txt flag_cloud_obs.txt flag_plume_obs.txt ger_lwc_obs.txt heading_obs.txt iso_blue_back_s_obs.txt iso_blue_eff_s_obs.txt iso_blue_red_angstrom_obs.txt iso_blue_smooth_abs_obs.txt iso_blue_ssa_obs.txt iso_blue_tot_s_obs.txt iso_cn_obs.txt iso_flag_qc_obs.txt iso_green_back_s_obs.txt ptrms_acetaldehyde_obs.txt ptrms_acetone_obs.txt ptrms_acetonitile_obs.txt ptrms_benzene_obs.txt ptrms_isoprene_obs.txt ptrms_mek_macr_obs.txt ptrms_methanol_obs.txt ptrms_mvk_obs.txt ptrms_tmb_obs.txt ptrms_toluene_obs.txt ptrms_xylene_obs.txt sat_temperature_obs.txt so2_obs.txt so4_obs.txt temperature_obs.txt w_prime_obs.txt wind_direction_obs.txt wind_speed_obs.txt
Problem With Particle Size Distribution PROBLEM: Because WRF Bin size ranges and Instrument Channel size ranges are different, calculations for output files will be wrong SOLUTION: Write a separate program [for each Instrument Channel] that will map Instrument Channels to correct WRF Bins [for both 8 Bin WRF & 4 Bin WRF] based on size ranges
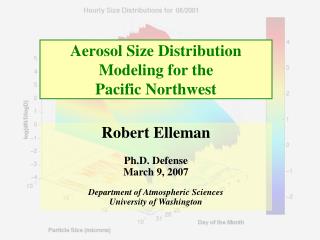
Instrument Channel Size Ranges 0.018 - 0.4 um
Mapping File 8 Bin WRF Bin Size Ranges [um] PCASP Instrument Channels Mapped to 8 Bin WRF Bins PCASP Instrument Channels Mapped to 4 Bin WRF Bins 4 Bin WRF Bin Size Ranges [um]
Create Output Files For Instrument Channels & WRF Bins Using MILAGRO Convention Total Number (n): The sum of all the particles within the specified channel n = value Total Area (a): The entire area of all the particles within the specified channel a = value1 ( * r ^2) + … r = midpoint of channel size range Total Volume (v): The entire volume of all the particles within the specified channel v = value1 * (4/3) * ( * r ^3) + … r = midpoint of channel size range Instrument Channels 8 Bin WRF Bins pcasp_ch_1_obs.txt pcasp_ch_2_obs.txt pcasp_ch_3_obs.txt pcasp_ch_4_obs.txt pcasp_ch_5_obs.txt pcasp_ch_6_obs.txt pcasp_ch_7_obs.txt pcasp_ch_8_obs.txt pcasp_ch_9_obs.txt pcasp_ch_10_obs.txt pcasp_ch_11_obs.txt pcasp_ch_12_obs.txt pcasp_ch_13_obs.txt pcasp_ch_14_obs.txt pcasp_ch_15_obs.txt pcasp_ch_16_obs.txt pcasp_ch_17_obs.txt pcasp_ch_18_obs.txt pcasp_ch_19_obs.txt pcasp_ch_20_obs.txt pcasp_ch_21_obs.txt pcasp_ch_22_obs.txt pcasp_ch_23_obs.txt pcasp_ch_24_obs.txt pcasp_ch_25_obs.txt pcasp_ch_26_obs.txt pcasp_ch_27_obs.txt pcasp_ch_28_obs.txt pcasp_ch_29_obs.txt pcasp_ch_30_obs.txt pcasp_8binwrf_bin1area_ins_obs.txt pcasp_8binwrf_bin1number_obs.txt pcasp_8binwrf_bin1volume_ins_obs.txt pcasp_8binwrf_bin2area_ins_obs.txt pcasp_8binwrf_bin2number_obs.txt pcasp_8binwrf_bin2volume_ins_obs.txt pcasp_8binwrf_bin3area_ins_obs.txt pcasp_8binwrf_bin3number_obs.txt pcasp_8binwrf_bin3volume_ins_obs.txt pcasp_8binwrf_bin4area_ins_obs.txt pcasp_8binwrf_bin4number_obs.txt pcasp_8binwrf_bin4volume_ins_obs.txt pcasp_8binwrf_bin5area_ins_obs.txt pcasp_8binwrf_bin5number_obs.txt pcasp_8binwrf_bin5volume_ins_obs.txt pcasp_8binwrf_bin6area_ins_obs.txt pcasp_8binwrf_bin6number_obs.txt pcasp_8binwrf_bin6volume_ins_obs.txt pcasp_8binwrf_bin7area_ins_obs.txt pcasp_8binwrf_bin7number_obs.txt pcasp_8binwrf_bin7volume_ins_obs.txt pcasp_8binwrf_bin8area_ins_obs.txt pcasp_8binwrf_bin8number_obs.txt pcasp_8binwrf_bin8volume_ins_obs.txt 4 Bin WRF Bins Same Location File Data Same Location File Data Same Location File Data pcasp_4binwrf_bin1area_ins_obs.txt pcasp_4binwrf_bin1number_obs.txt pcasp_4binwrf_bin1volume_ins_obs.txt pcasp_4binwrf_bin2area_ins_obs.txt pcasp_4binwrf_bin2number_obs.txt pcasp_4binwrf_bin2volume_ins_obs.txt pcasp_4binwrf_bin3area_ins_obs.txt pcasp_4binwrf_bin3number_obs.txt pcasp_4binwrf_bin3volume_ins_obs.txt pcasp_4binwrf_bin4area_ins_obs.txt pcasp_4binwrf_bin4number_obs.txt pcasp_4binwrf_bin4volume_ins_obs.txt
Analysis Toolkit Structure king_air CHAPS
Directory Tree Setup (G-1) Directory Tree Setup (King Air)
Time Series Plots From Toolkit Temperature Pressure Water Vapor Mixing Ratio Wind Speed
Histograms For King Air Data Aerosol Optical Depth Cloud Top Height
A Special Thanks To… Anne Case Hanks, Boniface Mills University of Louisiana at Monroe Jeff Gaffney, Milton Constantin Global Change Education Program Larry Berg, Carl Berkowitz, Elaine Chapman,Jim Droppo, Bill Gustafson, Laura Riihimaki, Jeremy Rishel, William Shaw, Tricia St Hilaire Pacific Northwest National Laboratory
King Air Output Files king_air_070611_loc.txt aerosol_optical_depth_obs.txt altitude_obs.txt cloud_top_height_obs.txt lat_obs.txt long_obs.txt planetary_boundary_layer_1_obs.txt planetary_boundary_layer_2_obs.txt planetary_boundary_layer_3_obs.txt time_obs.txt • Transect Flag (tflag) • Parameters: • Flight Leg 2 (L2) = 2 • Flight Leg 1 (L1) = 1 Location File
King Air Statistics Histogram Histogram Standard Statistics Standard Statistics Data Distribution Data Distribution Aerosol Optical Depth Cloud Top Height