Download
1 / 32
320 likes | 500 Vues
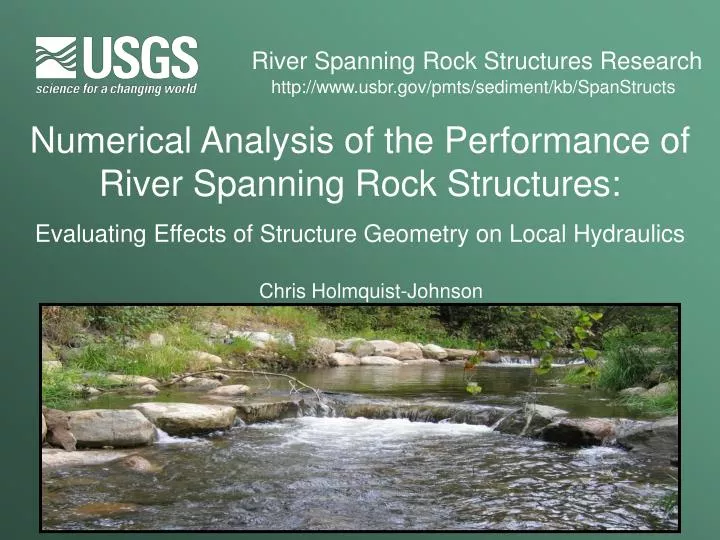
River Spanning Rock Structures Research. http://www.usbr.gov/pmts/sediment/kb/SpanStructs. Numerical Analysis of the Performance of River Spanning Rock Structures: Evaluating Effects of Structure Geometry on Local Hydraulics . Chris Holmquist-Johnson. Background.

E N D
River Spanning Rock Structures Research http://www.usbr.gov/pmts/sediment/kb/SpanStructs Numerical Analysis of the Performance of River Spanning Rock Structures: Evaluating Effects of Structure Geometry on Local Hydraulics Chris Holmquist-Johnson
Background • Rock weirs capabilities include: fish passage, bank protection, channel profile stability, and improved aquatic habitat. • Rock weirs are ideal structures for conditions of…steep slopes, diversions, scalability, habitat, and aesthetics. • Failures or loss of function can result in: disruption of service, expensive repairs, maintenance cost, failure to meet biological and geomorphic requirements, and loss of prestige.
Background • Qualitative field evaluations and Initial laboratory results found widespread performance issues. • We think this is a flaw in the designs, not in the concept. • The Rock Weir Design Guidelines Project was developed to investigate failure mechanisms and provide methods for designing sustainable structures.
Research Components The Research Project takes a multifaceted approach incorporating mutually supporting field, laboratory, and numerical studies. • Provides a controlled setting • Includes scour processes • Physically replicates hydraulics Field • Inexpensively simulates large numbers of cases • Increases range of applicability • Provides a design tool Laboratory Computer
Need for Physical Modeling • Field investigation identified growth of a scour hole causing geotechnical movement as the primary failure mechanism for rock weirs • Understanding the scour processes and quantities provides vital information on failure modes and potential counter measures required to design sustainable structures • Understanding failure modes in the field is COMPLICATED • Analyzing scour hole development is best answered in a controlled environment such as the laboratory
Max scour U-weir generated two defined scour hole locations Need for Physical Modeling Difference in anticipated scour hole definition and physical model results Assumed Rosgen (2001) - Physical Model (Qbankfull, Small cobble)
Physical Modeling Objectives • Rating curves for flood elevations • Scour prediction method • Potential counter measures and retrofits • Low flow depths and velocities for fish passage criteria
Evaluations of Field Performance The field evaluation included 21 sites consisting of 127 structures and included various structure designs by Reclamation, Natural Resources Conservation Service (NRCS), Dave Rosgen, and Oregon Department of Fish and Wildlife (ODFW). The observed range of conditions included: • Approximate channel widths from 15 feet to 250 feet • Approximate channel slopes from 0.5% to 2% • 75 U-or V-weirs,28 J-hooks, 12 A-weirs, 4 W-weirs, and 2 rock ramps
Displacement of Header rocks along arm Redirection of flow at bankfull Q A-weir with throat buried by sediment Evaluation of Field Performance • Field measurements provide a practical link to guide and validate laboratory and numerical investigations. • Field evaluations identified several failure mechanisms. • Scour and Slumping • Flanking • Loss of Pool Depth • Incipient Motion • Identifying failure pathways allows for design of countermeasures.
Velocity Vectors Returning Parallel to Bed Velocity Vectors Parallel to Bed Hydraulic Jump Rapid Vertical Contraction and Expansion over the Weir Crest Plunging Flow Importance of Numerical Modeling • Field and laboratory provide data over a limited range of conditions. • Narrower ranges of conditions limit the applicability of results. • Numerical modeling provides opportunity to test numerous design parameters over large ranges for less money and in a shorter amount of time to extend the applicability.
Numerical Model Design Parameters • Bed Material and Slope • Coarse Gravel to Large Cobble (23mm to 181mm) • Slope .001, .005, and .01 • Channel Geometry • Regime Equations (Parker et al. 2007) S = bed slope; Qbf = bankfull discharge (m3/s); Ds50 = median particle diameter, (m); Wbf = bankfull width (m); Hbf = bankfull depth (m).
2-7 Percent Numerical Model Design Parameters • Structure Geometry • Drop height • 0.4, 0.8, 1.2 ft • Throat Width • .25W, .33W, and .5W • Arm Length (arm slope & departure angle) • .5 and 2 times minimum deviation (4.5% and 25degrees)
Numerical Model • 3D model • U2RANS- (Yong Lai, Reclamation) • Unsteady and Unstructured Reynolds Averaged Navier-Stokes solver • Preprocessor, CFD solver • Mesh Generation and Post Processing • Auto mesh generator, SMS, Tec Plot
1/3 W 1/3 W Bank Full 2-7 Percent 20-30 0.8 ft Numerical Model Validation • Laboratory comparison U-Weir Design Concept Construction Before Test
Bed topography from LIDAR scan Surface velocity distribution with stream lines Numerical Model Validation • Laboratory comparison U-Weir Bed shear stress distribution at Qbkfull
Numerical Model Validation • Laboratory comparison U-Weir water surface profile comparison
Numerical Model Validation • Laboratory comparison U-Weir Velocity Comparison
Numerical Model Validation • Field comparison Field U-weir Velocity at Qbkfull
Numerical Model Validation • Field comparison
Numerical Model Validation • Field comparison
Numerical Model Results-Varying Flow Rate • 1/3W • 4.5% slope • 25 degrees
Numerical Model Results-Structure Geometry (Qbkf) • 2*Arm Length • ½*Arm Length
Numerical Model Results-Structure Geometry (1/3Qbkf) • 2*Arm Length • ½*Arm Length
Numerical Model Results • Results from the numerical model show a significant change in velocity and shear stress distributions when the geometry of the structure is altered • Currently working on a statistical method for describing the variation in velocity and bed shear stress to structure configuration
Numerical Model Results Assist In: • Optimizing structure geometry for given restoration needs (Diversion, Fish passage, bank protection, pool development, etc.), • Analysis of flow hydraulics resulting from differing structure configurations, • Predicting DS scour hole development, and • Providing techniques for analyzing, designing, and constructing sustainable rock weir structures.
Research Summary • The research produces tools and guidelines for structure design or retrofits based upon predictable engineering and hydraulic performance criteria. • Understanding the processes governing success and failure allow designers to construct robust and sustainable structures requiring fewer repairs, less disruption of service, and lower maintenance costs. • Guidelines simplify and reduce future design efforts while increasing the likelihood of successful structures. • We hope that solidly developed criteria will simplify the regulatory permitting processes.
In the End • Reliable structure designs reduce failures, • Reduced failures results in fewer retrofits, • Fewer retrofits saves money, • Saving money while meeting regulatory requirements governing habitat and fish passage makes everyone happy
Colorado State University Dr. Chris Thornton and Dr. Chester Watson Tony Meneghetti, Mike Skurlock Reclamation Kent Collins, Kendra Russell, Elaina Holburn, David Mooney Science & Technology program Pacific Northwest Area office Special Thanks To: