Download
1 / 26
260 likes | 496 Vues
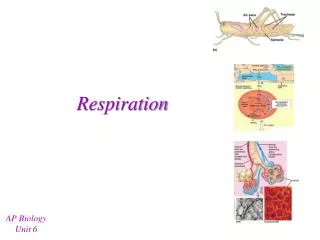
Respiration. Breathing and Respiration Cellular Aerobic Respiration Efficiency of Respiration Cellular Anaerobic Respiration Respiration of Carbohydrate, Protein & Fat. Outline – Cellular Respiration. Fig 6.2 Breathing and Respiration. 0. CO 2. O 2. Breathing. Lungs. O 2. CO 2.

E N D
Breathing and Respiration Cellular Aerobic Respiration Efficiency of Respiration Cellular Anaerobic Respiration Respiration of Carbohydrate, Protein & Fat Outline – Cellular Respiration
Fig 6.2 Breathing and Respiration 0 CO2 O2 Breathing Lungs O2 CO2 Bloodstream Muscle cells Cellular Respiration Glucose + O2 CO2 +H2O +ATP
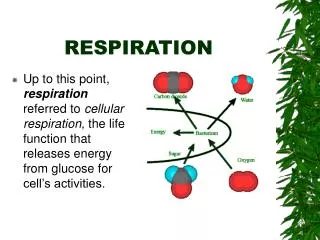
Loss of hydrogen atoms (oxidation) Gain of hydrogen atoms (reduction) Cellular Aerobic Respiration 0 Glucose molecules broken down to CO2 Glucose loses electrons and hydrogen Oxidation Oxygen gains electrons and hydrogen Reduction Cells tap energy from electrons Cells bank energy in ATP (Energy) C6H12O6 ATP + 6 CO2 6 O2 + 6 H2O + Glucose
Transferring Energy in the cell Figure 6.5B 0 Oxidation - Enzyme removes electrons from substrate Reduction - Electrons in Hydrogen Transferred to NAD+ Oxidation H H 2H O O + Dehydrogenase Enzyme Reduction + 2H H+ + NADH NAD+ (carries 2 electrons) + 2e 2H+
AEROBIC CELLULAR RESPIRATION 0 • Stages • Glycolysis • Chemical Grooming of Pyruvate • Citric acid cycle • Oxidative phosphorylation C6H12O6 ATP + 6 O2 6 CO2 + 6 H2O +
Cellular Respiration Stage 1: Glycolysis 0 • Occurs in the cytoplasm • Breaks down glucose into pyruvate • Reduces coenzyme NAD+ • Produces a small amount of ATP 2 H+ 2 NADH + 2 NAD+ 1 Glucose 2 Pyruvate 2 2 P 2 ADP ATP + Figure 6.7A
3 1 4 Cellular Respiration: Glycolysis Major steps in glycolysis 1. Preparatory phase: 2 ATP energize glucose PREPARATORY PHASE Glucose Steps – A fuel molecule is energized, using ATP. ATP Step 1 ADP Glucose-6-phosphate P 2 P Fructose-6-phosphate ATP 3 ADP Fructose-1,6-bisphosphate P P Step A six-carbon intermediate splits into two three-carbon intermediates. 4 Figure 6.7C
5 5 6 6 7 7 8 8 9 9 Cellular Respiration: Glycolysis 2. Energy Payoff: NADH+H+ is formed 3. Energy Payoff: ATP is formed 4. Pyruvate is formed Cleavage of 6C sugar P P Glyceraldehyde-3-phosphate(G3P) Step A redox reaction generates NADH. 5 6 9 ENERGY PAYOFF PHASE NAD NAD P P 6 6 NADH+H NADH+H P P P P 1,3-Diphosphoglycerate Steps – ATP and pyruvate are produced. 9 6 ADP ADP 7 7 ATP ATP Energy Payoff P 3-Phosphoglycerate P P P 8 8 2-Phosphoglycerate H2O H2O P P Phosphoenolpyruvate(PEP) 9 9 ADP ADP ATP Energy Payoff ATP Pyruvate Figure 6.7C
Cellular Respiration: Glycolysis 0 Glycolysis produces ATP by substrate-level phosphorylation Enzyme P P P Adenosine ATP ADP P Organic molecule(substrate) P Figure 6.7B
Cellular Respiration Stage 2: Chemical Grooming of Pyruvate Pyruvate is oxidized: • Releases CO2 • Produces NADH and acetyl Coenzyme A • Acetyl CoA is transferred to the mitochondrion NAD+ NADH + H+ CoA Pyruvate Acetyl Coenzyme A CO2 Coenzyme A Figure 6.8
1 2 4 3 2 4 1 3 Cellular Respiration Stage 3: Citric Acid Cycle Acetyl CoA CoA 2 carbons enter cycle Oxaloacetate Citrate NADH + H+ CO2 NAD+ NAD+ Malate NADH + H+ ADP + P FADH2 ATP Alpha-ketoglutarate FAD CO2 Succinate NAD+ Figure 6.9B NADH + H+
Stage 3: Citric Acid Cycle 0 • Completely oxidizes “glucose” to CO2 • Produces a small amount of ATP • Supplies electrons to last stage of cellular respiration by reducing Coenzymes FAD & NAD
Mitochondrion Structure Outer Membrane Inner Membrane Cristae Intermembrane Space Matrix
H+ H+ O H2O e- e- Electron Transport Chain H+ H+ H+ H+ H+ H+ H+ H+ H+ H+ H+ H+ Stage 4: Oxidative Phosphorylation 0 • Electron Flow occurs in mitochondrial membrane • Protons are transported across the inner mitochondrial membrane • ATP is synthesized by Chemiosmosis H2O . H+ H+ H+ H+ H+ H+ H+ H+ H+ Intermembrane space Inner mitochondrial membrane FADH2 FAD NADH NAD+ H+ Mitochondrial matrix Figure 6.10
ADP P Electron Transport Chain H+ H+ H+ H+ H+ H+ H+ H+ H+ H+ H+ H+ H+ H+ H+ H+ H+ H+ H+ H+ H+ H+ H+ Chemiosmosis by ATP synthase Stage 4: Oxidative Phosphorylation ATP Synthesis by Chemiosmosis ATP
O2 H+ ATP P ADP e- e- e- Electron Transport Chain H+ H+ H+ H+ H+ H+ H+ H+ H+ H+ H+ H+ Stage 4: Oxidative Phosphorylation 0 • Electron Flow occurs in mitochondrial membrane • Protons are transported across the inner mitochondrial membrane • ATP is synthesized by Chemiosmosis . H+ H+ H+ H+ H+ Protein complex H+ H+ ATP synthase H+ Electron carrier H+ Intermembrane space Inner mitochondrial membrane FADH2 FAD NADH NAD+ H+ Mitochondrial matrix H2O H+ Chemiosmosis OXIDATIVE PHOSPHORYLATION Figure 6.10
Stage 4: Oxidative Phosphorylation 0 • Occurs in the mitochondria • Uses the energy released by electrons to pump H+ across a membrane • Harnesses the energy of the H+ gradient through chemiosmosis, producing ATP
1 2 Oxidative Phosphorylation Connection 0 • Certain poisons interrupt oxidative phosphorylation • Rotenone blocks the movement of electrons • Oligomycin blocks H+ flow through ATP synthase • DNP allows H+ to leak through the membrane Oligomycin Cyanide, carbon monoxide Rotenone Genus: Derris oligomycin from the fungusStreptomyces H+ H+ H+ ATPSynthase H+ H+ H+ H+ H+ H+ DNP Young Man Dies after Using a Diet Pill containing Dinitrophenol (DNP) FAD FADH2 + O2 2 H+ NADH NAD+ H+ + ATP P ADP H+ H2O H+ Electron Transport Chain Chemiosmosis Figure 6.11
Summary: Aerobic Cellular Respiration 0 Cytoplasm Mitochondrion NADH+H+ NADH+H+ FADH2 GLYCOLYSIS CITRIC ACIDCYCLE OXIDATIVE PHOSPHORYLATION AcetylCoA Pyruvate Glucose 34 ATP 2 ATP 2 ATP by oxidative phosphorylation by substrate-level phosphorylation by substrate-level phosphorylation About 38 ATP for each glucose Figure 6.12
Anaerobic Cellular Respiration 0 • Fermentation = an anaerobic alternative to cellular respiration Uses glycolysis alone to produce small amounts of ATP Types of fermentation 1. Lactic acid fermentation 2. Alcoholic fermentation
Lactic Acid Fermentation 0 • NADH is oxidized to NAD+ • Pyruvate is reduced to lactate NAD+ NADH NADH NAD+ GLYCOLYSIS Pyruvate ADP + ATP P Lactate Glucose Figure 6.13A
Alcohol Fermentation 0 • NADH is oxidized to NAD+ • Pyruvate is converted to CO2 and ethanol NADH NADH NAD+ NAD+ GLYCOLYSIS Glucose Ethanol ADP + CO2 Pyruvate ATP P Figure 6.13B
Fuels for Respiration 0 • Carbohydrates, fats, and proteins converted to molecules entering • Glycolysis or citric acid cycle Food, such as peanuts Fats Carbohydrates Proteins Sugars Fatty acids Amino acids Glycerol Aminogroups CITRICACIDCYCLE OXIDATIVE PHOSPHORYLATION AcetylCoA Pyruvate Glucose G3P GLYCOLYSIS ATP Figure 6.14
0 • Fuel for respiration comes from photosynthesis • All organisms • Respire • Plants, but not animals • Respire and Photosynthesize Figure 6.16