Download
1 / 1
10 likes | 105 Vues
----- [10] ----- [01]. ----- [11] ----- [21]. [10]. Azimuthal angle (degrees). [11]. [01]. q x (nm -1 ). [10]. [11]. Azimuthal angle (degrees). [01]. q x (nm -1 ). Grazing Incidence X-ray Scattering from Patterned Nanoscale Dot Arrays.

E N D
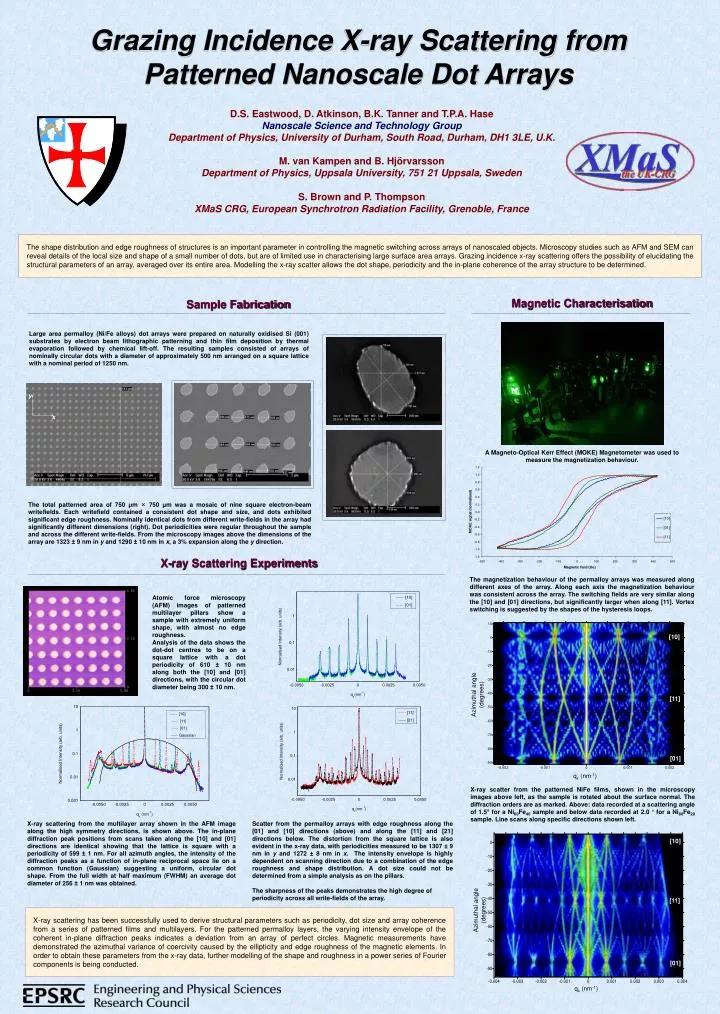
----- [10] ----- [01] ----- [11] ----- [21] [10] Azimuthal angle (degrees) [11] [01] qx (nm-1) [10] [11] Azimuthal angle (degrees) [01] qx (nm-1) Grazing Incidence X-ray Scattering from Patterned Nanoscale Dot Arrays D.S. Eastwood, D. Atkinson, B.K. Tanner and T.P.A. Hase Nanoscale Science and Technology Group Department of Physics, University of Durham, South Road, Durham, DH1 3LE, U.K. M. van Kampen and B. HjörvarssonDepartment of Physics, Uppsala University, 751 21 Uppsala, Sweden S. Brown and P. Thompson XMaS CRG, European Synchrotron Radiation Facility, Grenoble, France The shape distribution and edge roughness of structures is an important parameter in controlling the magnetic switching across arrays of nanoscaled objects. Microscopy studies such as AFM and SEM can reveal details of the local size and shape of a small number of dots, but are of limited use in characterising large surface area arrays. Grazing incidence x-ray scattering offers the possibility of elucidating the structural parameters of an array, averaged over its entire area. Modelling the x-ray scatter allows the dot shape, periodicity and the in-plane coherence of the array structure to be determined. Magnetic Characterisation Sample Fabrication Large area permalloy (Ni/Fe alloys) dot arrays were prepared on naturally oxidised Si (001) substrates by electron beam lithographic patterning and thin film deposition by thermal evaporation followed by chemical lift-off. The resulting samples consisted of arrays of nominally circular dots with a diameter of approximately 500 nm arranged on a square lattice with a nominal period of 1250 nm. y x A Magneto-Optical Kerr Effect (MOKE) Magnetometer was used to measure the magnetization behaviour. The total patterned area of 750 μm × 750 μm was a mosaic of nine square electron-beam writefields. Each writefield contained a consistent dot shape and size, and dots exhibited significant edge roughness. Nominally identical dots from different write-fields in the array had significantly different dimensions (right). Dot periodicities were regular throughout the sample and across the different write-fields. From the microscopy images above the dimensions of the array are 1323 ± 9 nm in y and 1290 ± 10 nm in x, a 3% expansion along the y direction. X-ray Scattering Experiments The magnetization behaviour of the permalloy arrays was measured along different axes of the array. Along each axis the magnetization behaviour was consistent across the array. The switching fields are very similar along the [10] and [01] directions, but significantly larger when along [11]. Vortex switching is suggested by the shapes of the hysteresis loops. Atomic force microscopy (AFM) images of patterned multilayer pillars show a sample with extremely uniform shape, with almost no edge roughness. Analysis of the data shows the dot-dot centres to be on a square lattice with a dot periodicity of 610 ± 10 nm along both the [10] and [01] directions, with the circular dot diameter being 300 ± 10 nm. ----- [10] ----- [11] ----- [01] ----- Gaussian X-ray scatter from the patterned NiFe films, shown in the microscopy images above left, as the sample is rotated about the surface normal. The diffraction orders are as marked. Above: data recorded at a scattering angle of 1.5° for a Ni60Fe40 sample and below data recorded at 2.0 ° for a Ni80Fe20 sample. Line scans along specific directions shown left. X-ray scattering from the multilayer array shown in the AFM image along the high symmetry directions, is shown above. The in-plane diffraction peak positions from scans taken along the [10] and [01] directions are identical showing that the lattice is square with a periodicity of 599 ± 1 nm. For all azimuth angles, the intensity of the diffraction peaks as a function of in-plane reciprocal space lie on a common function (Gaussian) suggesting a uniform, circular dot shape. From the full width at half maximum (FWHM) an average dot diameter of 256 ± 1 nm was obtained. Scatter from the permalloy arrays with edge roughness along the [01] and [10] directions (above) and along the [11] and [21] directions below. The distortion from the square lattice is also evident in the x-ray data, with periodicities measured to be 1307 ± 9 nm in y and 1272 ± 8 nm in x. The intensity envelope is highly dependent on scanning direction due to a combination of the edge roughness and shape distribution. A dot size could not be determined from a simple analysis as on the pillars. The sharpness of the peaks demonstrates the high degree of periodicity across all write-fields of the array. X-ray scattering has been successfully used to derive structural parameters such as periodicity, dot size and array coherence from a series of patterned films and multilayers. For the patterned permalloy layers, the varying intensity envelope of the coherent in-plane diffraction peaks indicates a deviation from an array of perfect circles. Magnetic measurements have demonstrated the azimuthal variance of coercivity caused by the ellipticity and edge roughness of the magnetic elements. In order to obtain these parameters from the x-ray data, further modelling of the shape and roughness in a power series of Fourier components is being conducted.