Download
1 / 33
330 likes | 434 Vues
DRILLING LABORATORY THE WOODLANDS, TEXAS. EVALUATION OF TARIJA FORMATION SAMPLES. PRESENTATION HIGHLIGHTS. Simulator test objectives Inefficiencies relating to drilling the Tarija Formation Hughes Christensen drilling laboratory overview Pressure simulator overview

E N D
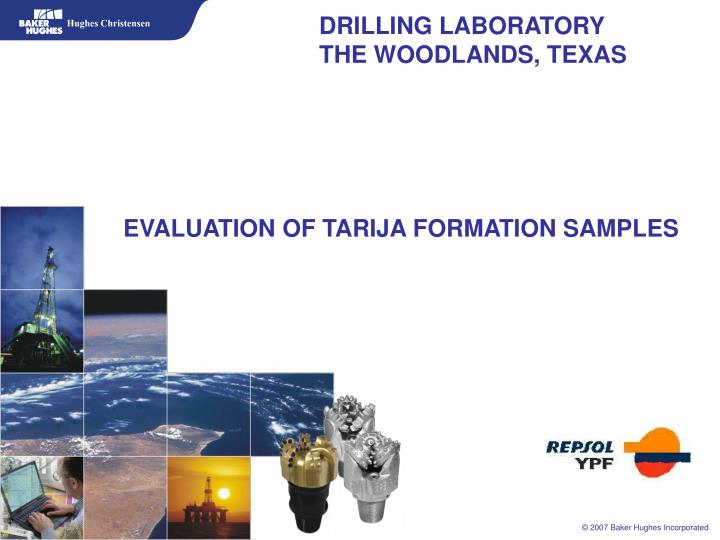
DRILLING LABORATORYTHE WOODLANDS, TEXAS EVALUATION OF TARIJA FORMATION SAMPLES
PRESENTATION HIGHLIGHTS • Simulator test objectives • Inefficiencies relating to drilling the Tarija Formation • Hughes Christensen drilling laboratory overview • Pressure simulator overview • Tarija sample outcrops in Bolivia • Mineralogy test results of the Tarija formation • Pressure simulator test results on two samples • Results evaluation • Suggestions
PRESSURE SIMULATOR TEST OBJECTIVES • Cost reduction on rig test vs. lab test • Prove drilling behavior of diamectites with different cutting structures • Mechanical Specific Energy (MSE) while drilling • Final bottom imprint • Drilling dysfunctions related to rock type • Obtain knowledge to design new cutting structures • REPSOL-YPF co-sponsored the test and provided the samples
DRILLING BEHAVIOR ON THE FIELD • Low efficiency = Low ROP = High drilling cost • OC and TR as main wear pattern • Limited drilling hours (more bit trips) = High drilling cost • High MSE • Bit and BHA vibrations • Optimization target is unknown and also hard to reach
OFF-CENTER DRILLING • Rock-Bit interaction • Poor lateral bit stability (BHA and Bit design) • High RPM • Bottom pattern generates track between the rows of inserts • Low efficiency = Low ROP = Short bit runs = Severe wear on bits • Can be associated to natural BHA imbalance • Bit cutting structure also affects behavior
OFF-CENTER ROTATION • OC simulation of a bit cutting structure • Movement is actually very subtle • Generates bottom tracks of formation between the rows of inserts
OFF-CENTER SYMPTOMS • Wear pattern concentrates on the cone shell • Can lead to exposing cone bearing (loss of cone) After the run Off-Center New Bit
OFF-CENTER SYMPTOMS • More severe cases under unstable conditions • Shirttail wear on one cone normally reveals OC behavior After the run Off-Center = Loss of the nose New Bit
TRACKING • Tracking simulation of a cutting structure • Bit inserts don’t cover the entire surface • Inserts fall in the same cavity left by a previous insert • Can be coupled to OC mode in certain situations Tracking No Tracking
TRACKING SYMPTOMS • Marks in between the inserts • Inserts with self-sharpening shape • Normally occurs in the outer rows of inserts (more probability) Marks in between inserts
MSE = MECHANICAL SPECIFIC ENERGY • Can be used to quantify drilling efficiency • Hard to measure on the field (bottom hole parameters normally not available) • Requires measurements very close to the bit • Higher WOB = Higher MSE • Higher RPM = Higher MSE • Higher TQ = Higher MSE • Lower ROP = Higher MSE • Efficiency = 1 = MSE / UCS
PRESSURE SIMULATORThe Woodlands, Texas • Indoor drilling laboratory • Simulates drilling conditions up to 6700m • Can be used to test bits under virtually any bottom hole condition • Analysis of parameters • Sensors measure bit-rock interaction • Bottom hole imprint after test • Simulates hydrostatic conditions
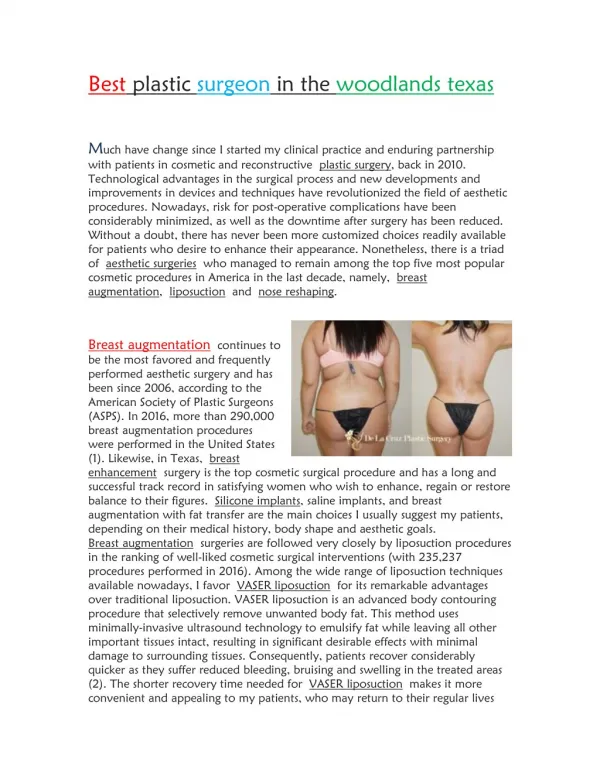
TARIJA SAMPLES - BOLIVIA • Initial mineralogy test samples from Bermejo (Rock A) and Huacaya (Rock B) • Pressure simulator samples form Aguarague (high clay content) and Isiri (high quartz content)
TARIJA SAMPLES – MINERALOGY TEST • Smaller samples for mineralogy tests • Rock sample A from Bermejo area • Rock sample B from Huacaya area
MINERALOGY TEST RESULTS • Both rocks are basically the same type according to spider plot • The rock in both cases is medium strength under Mohr-failure envelope • Higher quartz content reflects higher UCS values • P-S wave behavior shows dissimilar strength behavior • Higher clay content (lower UCS) seems to act as a harder rock under confinement • Linear relation of UCS may not be a good value to look at when evaluating diamectites
SIMULATOR TEST SAMPLES • ISIRI samples show greater compaction and also greater sand content • AGUARGUE samples show higher clay content, very fractured and low strength. Weathering process show effect on all samples
SAMPLES AFTER CUTTING • 4 large samples from ISIRI are sent to Savannah, Georgia for cylindrical cutting process • Only 2 samples survive transport and cutting process (fractured rock) • Surviving samples are protected by fiberglass coating
PRESSURE SIMULATOR TESTS • Test both samples under equal conditions • SAMPLE A: 12¼” GX-09DX (IADC 437), 7 inner rows, 3 outer rows, 88 compacts • SAMPLE B: 12¼” EP6312 (IADC 517), 8 inner rows, 3 outer rows, 133 compacts • RPM: 150 • WOB: 15-20-25-30-35 Klbs • 450GPM, Water based mud 9.5ppg, Nozzles 3x15, TFA = 0.52in² • 1.47 HSI • 5800 PSI confinement pressure
TEST A: 12¼” GX-09DX • Bit with no damage • Formation-inserts sloughing on the bottom • OC initiation (ledges on the wall) • TR on bottom visible • Hard-Sandy formation with ductile behavior?
TEST B: 12¼” EP6312 Bit with no damage Cleaner bottom imprint No formation-insert sloughing Very minor tracking evidence No ledges on the wall
RESULTS AND COMPARISON • ISIRI samples show 95% quartz content • Previous samples ROCK A-B show 71% and 58% of quartz content respectively • Color and texture of the rock seem to differ from original samples • First sample was stuck for 5 days after the test due to fines generation (seals blocked) • UCS values of simulator samples are close to 26KSI which are closer to certain types of granite rock
PRELIMINARY CONCLUSIONS • EP6312 (new M features) is better adapted to formation properties • Need to validate results with a field run • Diamectite rock has quite unique properties (hard-ductile-wave resonance) • UCS is not a good index for diamectites • OC and TR are clearly related to cutting structure design • DART to implement features on 16-28” bits • More testing of samples is required to get a better idea on additional rock beahvior