Download
1 / 1
40 likes | 646 Vues
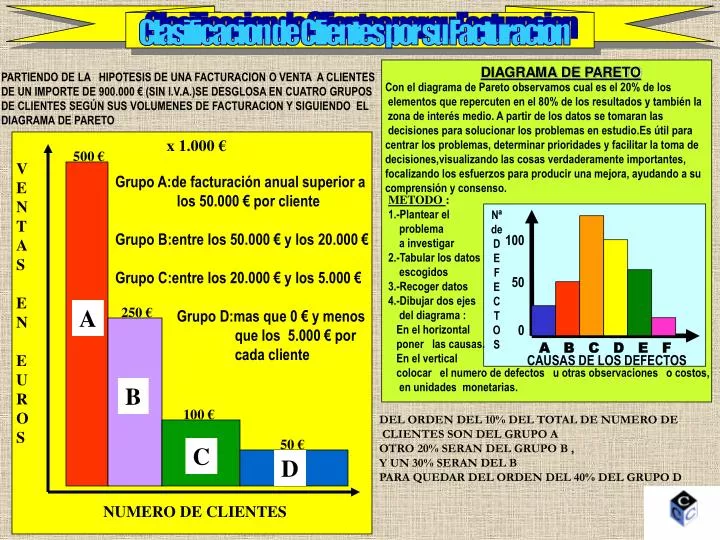
Clasificacion de Clientes por su Facturacion. DIAGRAMA DE PARETO. PARTIENDO DE LA HIPOTESIS DE UNA FACTURACION O VENTA A CLIENTES DE UN IMPORTE DE 900.000 € (SIN I.V.A.)SE DESGLOSA EN CUATRO GRUPOS DE CLIENTES SEGÚN SUS VOLUMENES DE FACTURACION Y SIGUIENDO EL DIAGRAMA DE PARETO.

E N D
Clasificacion de Clientes por su Facturacion DIAGRAMA DE PARETO PARTIENDO DE LA HIPOTESIS DE UNA FACTURACION O VENTA A CLIENTES DE UN IMPORTE DE 900.000 € (SIN I.V.A.)SE DESGLOSA EN CUATRO GRUPOS DE CLIENTES SEGÚN SUS VOLUMENES DE FACTURACION Y SIGUIENDO EL DIAGRAMA DE PARETO Con el diagrama de Pareto observamos cual es el 20% de los elementos que repercuten en el 80% de los resultados y también la zona de interés medio. A partir de los datos se tomaran las decisiones para solucionar los problemas en estudio.Es útil para centrar los problemas, determinar prioridades y facilitar la toma de decisiones,visualizando las cosas verdaderamente importantes, focalizando los esfuerzos para producir una mejora, ayudando a su comprensión y consenso. x 1.000 € 500 € V E N T A S E N E U R O S Grupo A:de facturación anual superior a los 50.000 € por cliente Grupo B:entre los 50.000 € y los 20.000 € Grupo C:entre los 20.000 € y los 5.000 € Grupo D:mas que 0 € y menos que los 5.000 € por cada cliente METODO : 1.-Plantear el problema a investigar 2.-Tabular los datos escogidos 3.-Recoger datos 4.-Dibujar dos ejes del diagrama : En el horizontal poner las causas. En el vertical colocar el numero de defectos u otras observaciones o costos, en unidades monetarias. Nª de D E F E C T O S 100 50 A 250 € 0 A B C D E F CAUSAS DE LOS DEFECTOS B 100 € DEL ORDEN DEL 10% DEL TOTAL DE NUMERO DE CLIENTES SON DEL GRUPO A OTRO 20% SERAN DEL GRUPO B , Y UN 30% SERAN DEL B PARA QUEDAR DEL ORDEN DEL 40% DEL GRUPO D 50 € C D NUMERO DE CLIENTES