Download
1 / 1
20 likes | 93 Vues
Effects of Urban and Non-Urban Land Cover on Nitrogen and Phosphorus Runoff to Chesapeake Bay. Allen D. Roberts and Stephen D. Prince. Department of Geography University of Maryland College Park, MD 20742. Introduction.

E N D
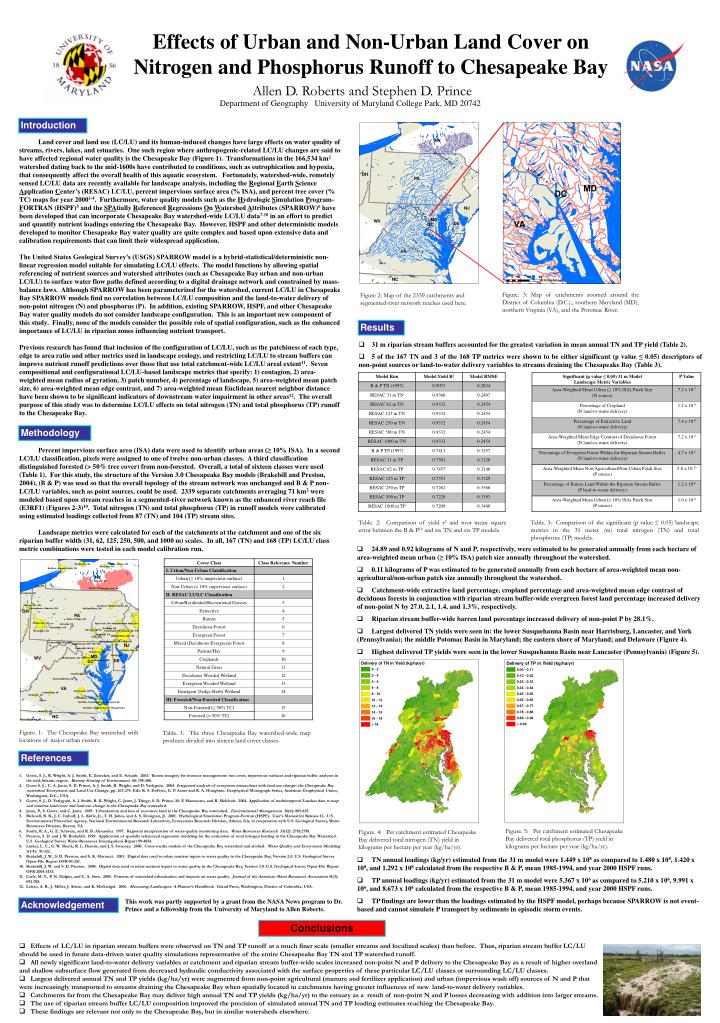
Effects of Urban and Non-Urban Land Cover on Nitrogen and Phosphorus Runoff to Chesapeake Bay Allen D. Roberts and Stephen D. Prince Department of Geography University of Maryland College Park, MD 20742 Introduction Land cover and land use (LC/LU) and its human-induced changes have large effects on water quality of streams, rivers, lakes, and estuaries. One such region where anthropogenic-related LC/LU changes are said to have affected regional water quality is the Chesapeake Bay (Figure 1). Transformations in the 166,534 km2 watershed dating back to the mid-1600s have contributed to conditions, such as eutrophication and hypoxia, that consequently affect the overall health of this aquatic ecosystem. Fortunately, watershed-wide, remotely sensed LC/LU data are recently available for landscape analysis, including the Regional Earth Science Application Center’s (RESAC) LC/LU, percent impervious surface area (% ISA), and percent tree cover (% TC) maps for year 20001-4. Furthermore, water quality models such as the Hydrologic Simulation Program-FORTRAN (HSPF)5 and the SPAtially Referenced Regressions On Watershed Attributes (SPARROW)6 have been developed that can incorporate Chesapeake Bay watershed-wide LC/LU data7-10 in an effort to predict and quantify nutrient loadings entering the Chesapeake Bay. However, HSPF and other deterministic models developed to monitor Chesapeake Bay water quality are quite complex and based upon extensive data and calibration requirements that can limit their widespread application. The United States Geological Survey’s (USGS) SPARROW model is a hybrid-statistical/deterministic non-linear regression model suitable for simulating LC/LU effects. The model functions by allowing spatial referencing of nutrient sources and watershed attributes (such as Chesapeake Bay urban and non-urban LC/LU) to surface water flow paths defined according to a digital drainage network and constrained by mass-balance laws. Although SPARROW has been parameterized for the watershed, current LC/LU in Chesapeake Bay SPARROW models find no correlation between LC/LU composition and the land-to-water delivery of non-point nitrogen (N) and phosphorus (P). In addition, existing SPARROW, HSPF, and other Chesapeake Bay water quality models do not consider landscape configuration. This is an important new component of this study. Finally, none of the models consider the possible role of spatial configuration, such as the enhanced importance of LC/LU in riparian zones influencing nutrient transport. Previous research has found that inclusion of the configuration of LC/LU, such as the patchiness of each type, edge to area ratio and other metrics used in landscape ecology, and restricting LC/LU to stream buffers can improve nutrient runoff predictions over those that use total catchment-wide LC/LU areal extent11. Seven compositional and configurational LC/LU-based landscape metrics that specify: 1) contagion, 2) area-weighted mean radius of gyration, 3) patch number, 4) percentage of landscape, 5) area-weighted mean patch size, 6) area-weighted mean edge contrast, and 7) area-weighted mean Euclidean nearest neighbor distance have been shown to be significant indicators of downstream water impairment in other areas12. The overall purpose of this study was to determine LC/LU effects on total nitrogen (TN) and total phosphorus (TP) runoff to the Chesapeake Bay. Figure. 3: Map of catchments zoomed around the District of Columbia (D.C.)., southern Maryland (MD), northern Virginia (VA), and the Potomac River. Figure 2: Map of the 2339 catchments and segmented-river network reaches used here. Results • 31 m riparian stream buffers accounted for the greatest variation in mean annual TN and TP yield (Table 2). • 5 of the 167 TN and 3 of the 168 TP metrics were shown to be either significant (p value ≤ 0.05) descriptors of non-point sources or land-to-water delivery variables to streams draining the Chesapeake Bay (Table 3). Methodology Percent impervious surface area (ISA) data were used to identify urban areas (≥ 10% ISA). In a second LC/LU classification, pixels were assigned to one of twelve non-urban classes. A third classification distinguished forested (> 50% tree cover) from non-forested. Overall, a total of sixteen classes were used (Table 1). For this study, the structure of the Version 3.0 Chesapeake Bay models (Brakebill and Preston, 2004), (B & P) was used so that the overall topology of the stream network was unchanged and B & P non-LC/LU variables, such as point sources, could be used. 2339 separate catchments averaging 71 km2 were modeled based upon stream reaches in a segmented-river network known as the enhanced river reach file (E3RF1) (Figures 2-3)10. Total nitrogen (TN) and total phosphorus (TP) in runoff models were calibrated using estimated loadings collected from 87 (TN) and 104 (TP) stream sites. Landscape metrics were calculated for each of the catchments at the catchment and one of the six riparian buffer width (31, 62, 125, 250, 500, and 1000 m) scales. In all, 167 (TN) and 168 (TP) LC/LU class metric combinations were tested in each model calibration run. Table. 2: Comparison of yield r2 and root mean square error between the B & P10 and six TN and six TP models. Table. 3: Comparison of the significant (p value ≤ 0.05) landscape metrics in the 31 meter (m) total nitrogen (TN) and total phosphorus (TP) models. • 24.89 and 0.92 kilograms of N and P, respectively, were estimated to be generated annually from each hectare of area-weighted mean urban (≥ 10% ISA) patch size annually throughout the watershed. • 0.11 kilograms of P was estimated to be generated annually from each hectare of area-weighted mean non-agricultural/non-urban patch size annually throughout the watershed. • Catchment-wide extractive land percentage, cropland percentage and area-weighted mean edge contrast of deciduous forests in conjunction with riparian stream buffer-wide evergreen forest land percentageincreased delivery of non-point N by 27.0, 2.1, 1.4, and 1.3%, respectively. • Riparian stream buffer-wide barren land percentageincreased delivery of non-point P by 28.1%. • Largest delivered TN yields were seen in: the lower Susquehanna Basin near Harrisburg, Lancaster, and York (Pennsylvania); the middle Potomac Basin in Maryland; the eastern shore of Maryland; and Delaware (Figure 4). • Highest delivered TP yields were seen in the lower Susquehanna Basin near Lancaster (Pennsylvania) (Figure 5). Figure. 1: The Chesapeake Bay watershed with locations of major urban centers. Table. 1: The three Chesapeake Bay watershed-wide map products divided into sixteen land cover classes. References • Goetz, S. J., R. Wright, A. J. Smith, E. Zinecker, and E. Schaub. 2003. Ikonos imagery for resource management: tree cover, impervious surfaces and riparian buffer analyses in the mid-Atlantic region. Remote Sensing of Environment 88: 195-208. • Goetz S. J., C. A. Jantz, S. D. Prince, A. J. Smith, R. Wright, and D. Varlyguin. 2004. Integrated analysis of ecosystem interactions with land use change: the Chesapeake Bay watershed. Ecosystems and Land Use Change, pp. 263-275. Eds. R. S. DeFries, G. P. Asner and R. A. Houghton. Geophysical Monograph Series, American Geophysical Union, Washington, D.C., USA. • Goetz, S. J., D. Varlyguin, A. J. Smith, R. K. Wright, C. Jantz, J. Tringe, S. D. Prince, M. E Mazzacato, and B. Melchoir. 2004. Application of multitemporal Landsat data to map and monitor land cover and land use change in the Chesapeake Bay watershed. • Jantz, P., S. Goetz, and C. Jantz. 2005. Urbanization and loss of resources land in the Chesapeake Bay watershed. Environmental Management 36(6): 805-825. • Bicknell, B. R., J. C. Imhoff, J. L. Kittle, Jr., T. H. Jobes, and A. S. Donigian, Jr. 2001. Hydrological Simulation Program-Fortran (HSPF). User’s Manual for Release 12. U.S. Environmental Protection Agency, National Environmental Research Laboratory, Ecosystems Research Division, Athens, GA, in cooperation with U.S. Geological Survey, Water Resources Division, Reston, VA. • Smith, R. A., G. E. Schwarz, and R. B. Alexander. 1997. Regional interpretation of water-quality monitoring data. Water Resources Research 33(12): 2781:2798. • Preston, S. D. and J. W. Brakebill. 1999. Application of spatially referenced regression modeling for the evaluation of total nitrogen loading in the Chesapeake Bay Watershed. U.S. Geological Survey Water-Resources Investigations Report 99-4054. • Linker, L. C., G. W. Shenk, R. L. Dennis, and J. S. Sweeney. 2000. Cross-media models of the Chesapeake Bay watershed and airshed. Water Quality and Ecosystems Modeling 1(1-4): 91-122. • Brakebill, J. W., S. D. Preston, and S. K. Martucci. 2001. Digital data used to relate nutrient inputs to water quality in the Chesapeake Bay, Version 2.0. U.S. Geological Survey Open-File Report OFR-01-251. • Brakebill, J. W. and S. D. Preston. 2004. Digital data used to relate nutrient inputs to water quality in the Chesapeake Bay, Version 3.0. U.S. Geological Survey Open-File Report OFR-2004-1433. • Carle, M. V., P. N. Halpin, and C. A. Stow. 2005. Patterns of watershed urbanization and impacts on water quality. Journal of the American Water Resources Association 41(3): 693-708. • Leitao, A. B., J. Miller, J. Ahern, and K. McGarigal. 2006. Measuring Landscapes: A Planner’s Handbook. Island Press, Washington, District of Columbia, USA. Figure. 5: Per catchment estimated Chesapeake Bay delivered total phosphorus (TP) yield in kilograms per hectare per year (kg/ha/yr). Figure. 4: Per catchment estimated Chesapeake Bay delivered total nitrogen (TN) yield in kilograms per hectare per year (kg/ha/yr). • TN annual loadings (kg/yr) estimated from the 31 m model were 1.449 x 10⁸ as compared to 1.480 x 10⁸, 1.420 x 10⁸, and 1.292 x 10⁸ calculated from the respective B & P, mean 1985-1994, and year 2000 HSPF runs. • TP annual loadings (kg/yr) estimated from the 31 m model were 5.367 x 10⁶ as compared to 5.210 x 10⁶, 9.991 x 10⁶, and 8.673 x 10⁶ calculated from the respective B & P, mean 1985-1994, and year 2000 HSPF runs. • TP findings are lower than the loadings estimated by the HSPF model, perhaps because SPARROW is not event-based and cannot simulate P transport by sediments in episodic storm events. This work was partly supported by a grant from the NASA News program to Dr. Prince and a fellowship from the University of Maryland to Allen Roberts. Acknowledgement Conclusions • Effects of LC/LU in riparian stream buffers were observed on TN and TP runoff at a much finer scale (smaller streams and localized scales) than before. Thus, riparian stream buffer LC/LU should be used in future data-driven water quality simulations representative of the entire Chesapeake Bay TN and TP watershed runoff. • All newly significant land-to-water delivery variables at catchment and riparian stream buffer-wide scales increased non-point N and P delivery to the Chesapeake Bay as a result of higher overland and shallow subsurface flow generated from decreased hydraulic conductivity associated with the surface properties of these particular LC/LU classes or surrounding LC/LU classes. • Largest delivered annual TN and TP yields (kg/ha/yr) were augmented from non-point agricultural (manure and fertilizer application) and urban (impervious wash off) sources of N and P that were increasingly transported to streams draining the Chesapeake Bay when spatially located in catchments having greater influences of new land-to-water delivery variables. • Catchments far from the Chesapeake Bay may deliver high annual TN and TP yields (kg/ha/yr) to the estuary as a result of non-point N and P losses decreasing with addition into larger streams. • The use of riparian stream buffer LC/LU composition improved the precision of simulated annual TN and TP loading estimates reaching the Chesapeake Bay. • These findings are relevant not only to the Chesapeake Bay, but in similar watersheds elsewhere.