Download
1 / 15
150 likes | 157 Vues
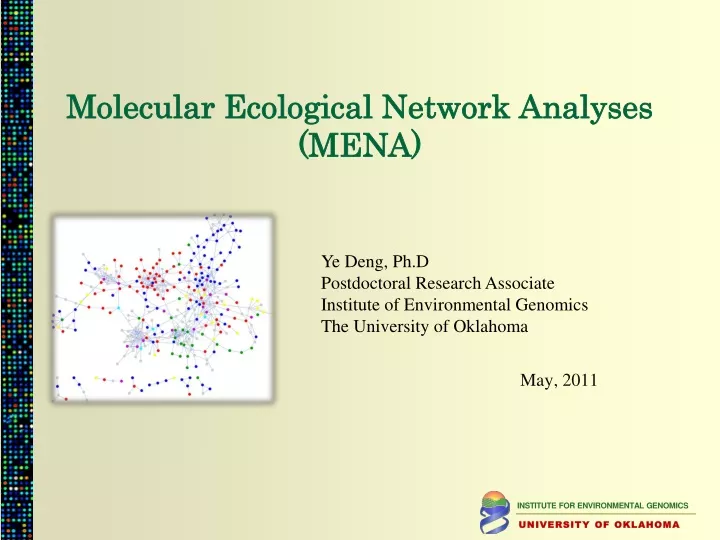
Molecular Ecological Network Analyses (MENA). Ye Deng, Ph.D Postdoctoral Research Associate Institute of Environmental Genomics The University of Oklahoma. May, 2011. From parts to interactions. RMT. concln. analysis. intro. Microbial species richness. Species network. Species diversity.

E N D
Molecular Ecological Network Analyses (MENA) Ye Deng, Ph.DPostdoctoral Research Associate Institute of Environmental GenomicsThe University of Oklahoma May, 2011
From parts to interactions RMT concln analysis intro Microbial species richness Species network Species diversity Species interactions Species abundance Different species Simpson index: The number of different species S = Adjacent matrix: Shannon index: • Conventional methods: Shannon diversity indexes • Species number and abundance of each species • Ignore interactions among different species …
Molecular Ecological network construction analysis concln intro RMT High throughput sequencing data (e.g. 16S pyrosequencing) or Microarray data Standardized relative abundance (SRA) of sequence numbers in a community Pair-wise similarity of gene abundance across different samples: e.g. Pearson correlation Determination of adjacency matrix by RMT-based approach
The RMT-based network construction intro concln analysis RMT Luo, Yang et al. BMC Bioinformatics, 2007, 8:299.
The RMT-based network construction intro concln analysis RMT • Each node indicates a OTU / species and different colors demonstrate the genus they belong to • The edge indicates the interaction between the linked the OTUs/species
The Molecular Ecological Network analyses RMT intro concln analysis • Overall, what is the network topology? the general network properties and modular structure • For individual species, who are the major players? the important nodes in the system • How does the network work? the network individuals/modules’ functions • For multiple networks, what are the differences between them? the network comparisons
The steps of MENA Network characterization and module detection RMT intro concln analysis Identification of topological roles of individual nodes Eigengene network analyses Network comparison between different conditions Association of network properties to ecological functional traits
Responses of grass ecosystems to elevated CO2 BioCON (Biodiversity, CO2, and Nitrogen) at the University of Minnesota by Peter Reich Each ring: 20m diameter RMT intro concln analysis Elevated CO2 There are 296 plots in total. Ambient CO2 Each plot: 2×2m
Modular organization of the MEN under ambient CO2 RMT intro concln analysis • Based on 454 sequencing data at ambient CO2. • All the MENs examined were modular, with distinct modules . • A module is a group of OTUs/functional genes that are highly correlated among themselves, but have few connections with OTUs/functional genes belonging to other modules.
The topological roles of nodes under ambient and elevated CO2 RMT intro concln analysis
Effects of eCO2 on the network interactions of Actinobacteria RMT intro concln analysis eCO2 aCO2 • Top 10 OTUs with the highest connectivity at eCO2 and their corresponding OTUs at aCO2 • More complicated network interactions at eCO2 than aCO2
Effects of eCO2 on the network interactions of Verrucomicrobia RMT intro concln analysis aCO2 eCO2 • Oppositely, the interaction of Verrucomircrobia was much less under eCO2 than aCO2.
Network connectivity vs. the soil geochemical traits RMT intro concln analysis
Conclusion RMT intro analysis concln • The high-throughput metagenomic data provide a great opportunity to study the microbial interactions in a large scale • The network analysis can help to identify the key species, compare community structure under different treatments, and link the network topology with environmental traits • Elevated CO2 dramatically altered the network interactions, indicating the switch of microbial community
Acknowledgement RMT intro analysis concln • Jizhong (Joe) Zhou • Zhili He • Liyou Wu • Feng Luo • Yunfeng Yang Funding Source: • US Department of Energy • United States Department of Agriculture Welcome to our online MENA pipeline: http://ieg2.ou.edu/MENA