Download
1 / 1
10 likes | 104 Vues
Spatial patterns of interaction among climate variability and change, soil water deficit and transpiration in small mountain catchments of Southern Sierra Critical Zone Observatory Kyongho Son and Christina Tague, Bren School of Environmental Science and management ,

E N D
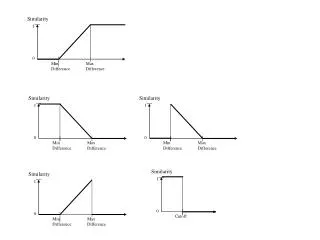
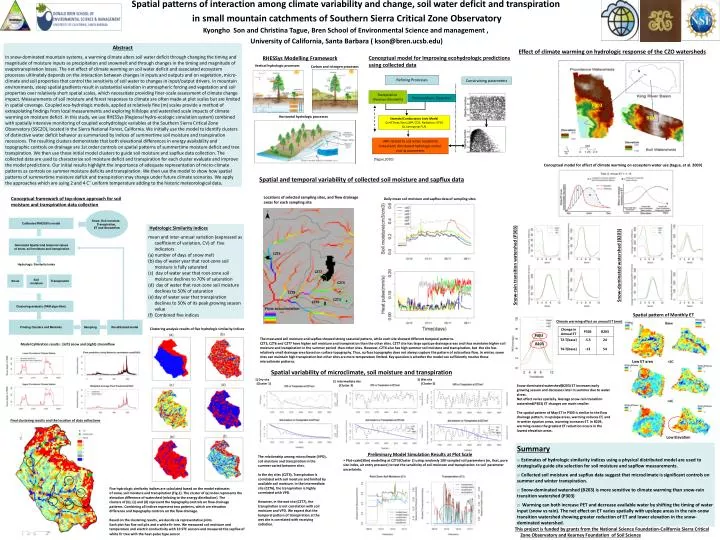
Spatial patterns of interaction among climate variability and change, soil water deficit and transpiration in small mountain catchments of Southern Sierra Critical Zone Observatory Kyongho Son and Christina Tague, Bren School of Environmental Science and management , University of California, Santa Barbara ( kson@bren.ucsb.edu) Snow, Soil moisture, Transpiration, ET and Streamflow Calibrated RHESSYs model Generated Spatial and temporal values of snow, soil moisture and transpiration CZT4 Hydrologic Similarity index Snow Transpiration Soil moisture CZT7 Clustering analysis (PAM algorithm) CZT5 CZT8 Finding Clusters and Medoids Sampling Recalibrated model CZT3 Refining Processes CZT6 Transpiration (Penman-Monteith) Photosynthesis (Farquhar) Stomatal Conductance Javis Model Gs=f(Tmax,Tmin,LWP, CO2, Radiation, VPD) Gs.canopy=gs*LAI LWP-related to soil water availability Linked withdistributed hydrologic model and its parameters (Tague,2010) Abstract In snow-dominated mountain systems, a warming climate alters soil water deficit through changing the timing and magnitude of moisture inputs as precipitation and snowmelt and through changes in the timing and magnitude of evapotranspiration losses. The net effect of climate warming on soil water deficit and associated ecosystem processes ultimately depends on the interaction between changes in inputs and outputs and on vegetation, micro-climate and soil properties that control the sensitivity of soil water to changes in input/output drivers. In mountain environments, steep spatial gradients result in substantial variation in atmospheric forcing and vegetation and soil properties over relatively short spatial scales, which necessitate providing finer-scale assessment of climate change impact. Measurements of soil moisture and forest responses to climate are often made at plot scales but are limited in spatial coverage. Coupled eco-hydrologic models, applied at relatively fine (m) scales provide a method of extrapolating findings from local measurements and exploring hillslope and watershed scale impacts of climate warming on moisture deficit. In this study, we use RHESSys (Regional hydro-ecologic simulation system) combined with spatially intensive monitoring of coupled ecohydrologic variables at the Southern Sierra Critical Zone Observatory (SSCZO), located in the Sierra National Forest, California. We initially use the model to identify clusters of distinctive water deficit behavior as summarized by indices of summertime soil moisture and transpiration recessions. The resulting clusters demonstrate that both elevational differences in energy availability and topographic controls on drainage are 1st order controls on spatial patterns of summertime moisture deficit and tree transpiration. We then use these initial model clusters to guide soil moisture and sapflux data collection. The collected data are used to characterize soil moisture deficit and transpiration for each cluster evaluate and improve the model predictions. Our initial results highlight the importance of adequate representation of micro-climate patterns as controls on summer moisture deficits and transpiration. We then use the model to show how spatial patterns of summertime moisture deficit and transpiration may change under future climate scenarios. We apply the approaches which are using 2 and 4 C° uniform temperature adding to the historic meteorological data. Effect of climate warming on hydrologic response of the CZO watersheds Conceptual model for Improving ecohydrologic predictions using collected data RHESSys Modelling Framework Vertical hydrologic processes Carbon and nitrogen processes Constraining parameters P303 Horizontal hydrologic processes B203 Conceptual model for effect of climate warming on ecosystem water use (tague, et al. 2009) Spatial and temporal variability of collected soil moisture and sapflux data Locations of selected sampling sites, and flow drainage areas for each sampling site Conceptual framework of top-down approach for soil moisture and transpiration data collection Daily mean soil moisture and sapflux data of sampling sites. Hydrologic Similarity indices mean and inter-annual variation (expressed as coefficient of variation, CV) of five indicators • (a) number of days of snow melt • (b) day of water year that root-zone soil moisture is fully saturated • (c) day of water year that root-zone soil moisture declines to 70% of saturation • (d) day of water that root-zone soil moisture declines to 50% of saturation • day of water year that transpiration declines to 50% of its peak growing season value • Combined five indices Snow-rain transition watershed (P303) Snow-dominated watershed (B203) Spatial pattern of Monthly ET Climate warming effect on annual ET (mm) Clustering analysis results of five hydrologic similarity indices P303 The measured soil moisture and sapflux showed strong seasonal pattern, while each site showed different temporal patterns. CZT5, CZT6 and CZT7 have higher soil moisture and transpiration than the other sites. CZT7 site has large upslope drainage areas and thus maintains higher soil moisture and transpiration in the summer period than other sites. However, CZT6 also has high summer soil moisture and transpiration, but the site has relatively small drainage area based on surface topography. Thus, surface topography does not always capture the pattern of subsurface flow. In winter, some sites can maintain high transpiration but other sites are more temperature limited. Key question is whether the model can sufficiently resolve these microclimate patterns. B203 Model Calibration results : (left) snow and (right) streamflow Low ET area Spatial variability of microclimate, soil moisture and transpiration 1) Dry site (Cluster 1) 3) Wet site (Cluster 5) 2) Intermediate site (Cluster 3) Snow-dominated watershed(B203) ET increases early growing season and decreases later in summer due to water stress. Net effect varies spatially. Average snow-rain transition watershed(P303) ET changes are much smaller. The spatial pattern of May ET in P303 is similar to the flow drainage pattern. In upslope areas, warming reduces ET, and in wetter riparian areas, warming increases ET. In B203, warming causes the greatest ET reduction occurs in the lowest elevation areas. Final clustering results and the location of data collections Low Elevation Summary • Estimates of hydrologic similarity indices using a physical distributed model are used to strategically guide site selection for soil moisture and sapflow measurements. • Collected soil moisture and sapflux data suggest that microclimate is significant controls on summer and winter transpiration. • Snow-dominated watershed (B203) is more sensitive to climate warming than snow-rain transition watershed (P303) • Warming can both increase PET and decrease available water by shifting the timing of water input (snow vs rain). The net effect on ET varies spatially with upslope areas in the rain-snow transition watershed showing greater reduction of ET and lower elevation in the snow-dominated watershed. Preliminary Model Simulation Results at Plot Scale The relationship among microclimate (VPD), soil moisture and transpiration in the summer varied between sites. In the dry sites (CZT3), Transpiration is correlated with soil moisture and limited by available soil moisture. In the intermediate site (CZT6), the transpiration is highly correlated with VPD. However, in the wet site (CZT7), the transpiration is not correlation with soil moisture and VPD. We expect that the temporal pattern of transpiration at the wet site is correlated with receiving radiation. • Plot-scale(30m) modelling at CZT3(Cluster 1) using randomly 100-sampled soil parameters (m, Ksat, pore size index, air entry pressure) to test the sensitivity of soil moisture and transpiration to soil parameter uncertainty. Five hydrologic similarity indices are calculated based on the model estimates of snow, soil moisture and transpiration (Fig.1). The cluster of (a) index represents the elevation difference of watershed (relating to the energy distribution). The clusters of (b), (c) and (d) represent the topography controls on flow drainage patterns. Combining all indices represent two patterns, which are elevation difference and topography controls on the flow drainage. Based on the clustering results, we decide six representative plots. Each plot has five soil pits and a white fir tree. We measured soil moisture and temperature and electric conductivity with 10 5TE sensors and measured the sapflux of white fir tree with the heat-pulse type sensor This project is funded by grants from the National Science Foundation-California Sierra Critical Zone Observatory and Kearney Foundation of Soil Science