Download
1 / 41
410 likes | 473 Vues
Board Meeting Data Presentation. August 25, 2009. Presentation Outline. CST Patterns and Trends Results of the Satisfaction Surveys. +2.8. +1.7. +1.3. +3.5. CST English Language Arts: 5-Year Trend for Proficient and Above (Grade 2 to 11). +2.8.

E N D
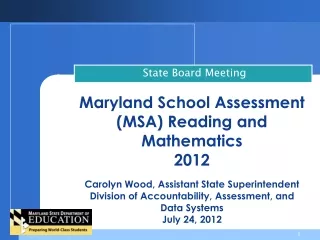
Board MeetingData Presentation August 25, 2009
Presentation Outline • CST Patterns and Trends • Results of the Satisfaction Surveys
+2.8 +1.7 +1.3 +3.5 CST English Language Arts:5-Year Trend for Proficient and Above(Grade 2 to 11)
+2.8 CST Mathematics:5-Year Trend for Proficient and Above(Grade 2 to 7)
CST English Language Arts:1-Year Gain for Proficient and Above(Grade 2 to 11)
CST Mathematics:1-Year Gain for Proficient and Above(Grade 2 to 7)
CST English Language Arts:Subgroup: SFUSD vs STATE (Grade 2 to 11)
CST English Language Arts:SFUSD Compared to the State and Other Urban Districts (Grade 2 to 11)
CST Mathematics:SFUSD Compared to the State and Other Urban Districts (Grade 2 to 7)
Summary – CST Patterns & Trends • Upward trend in CST ELA & Math • The achievement gap decreases • District is higher than State at every grade but lower for AA & L in both areas • The District will probably not meet AYP targets and is headed towards being PI 4 • In ELA & Math the movement of students from Basic to Proficient remains low
Purpose • Collect data for the BSC • Needs analysis about our learning environment • Continually improve and focus on our challenges while maintaining our successes
Survey Design A survey of 20 to 30 items was designed along the 3 goals of the BSC: • Access and Equity • Academic Achievement • Accountability Responses recorded on a 4-point scale: Strongly Agree, Agree, Disagree, Strongly Disagree and Don’t Know. All results, except the Administrator Satisfaction Survey, are disaggregated and reported by school.
2009 Survey Responses by BSC Goal GOAL 2: Academic Achievement
2009 Survey Responses by BSC Goal GOAL 2: Academic Achievement
2009 Survey Responses by BSC Goal GOAL 2: Academic Achievement
2009 Survey Responses by BSC Goal GOAL 2: Academic Achievement
2009 Survey Responses by BSC Goal GOAL 2: Academic Achievement
Survey Results Results are posted on our website. Search for “Satisfaction Surveys.”