Download
1 / 37
370 likes | 457 Vues
Illinois Farm Income Situation for 2002. by Dale Lattz, Paul Ellinger and Gary Schnitkey. Objectives. Evaluate the financial condition of Illinois grain farms. Examine the impact of the 2002 Farm Bill. Approach. Use a sample of Illinois FBFM grain farms with historical financial records.

E N D
Illinois Farm Income Situation for 2002 by Dale Lattz,Paul Ellinger and Gary Schnitkey
Objectives • Evaluate the financial condition of Illinois grain farms. • Examine the impact of the 2002 Farm Bill.
Approach • Use a sample of Illinois FBFM grain farms with historical financial records. • Use projections of NASS yields and prices to determine revenue for each farm. • Adjust historical expenses and financial data for each farm. • Project net farm income and net worth change for each farm in the sample.
Last Year’s Results Last year’s projection $29,686 actual income $30,771 projection on Nov 1 $ 1,085 difference • Expenses were projected on the mark • Missed revenue
Sample Farms by Size 993 grain farms Average farm: 855 total acres 635 operator acres
Increasing Grain Prices *Calendar year average
Key Assumptions • Estimated prices received / year end inventory price • Corn: $2.40 / bu. • Soybeans: $5.60 / bu. • Wheat: $3.20 / bu. • No estimated LDP’s included • Estimated crop insurance proceeds for the first time
Key Assumptions – cont. • Marketing margins on old crop • Corn: none (basically sold at inventory price) • Soybeans: Gain of $0.20/ bu. – 60% of crop • Pricing opportunities on new crop • Corn – none included • Soybeans – none included • Use NASS November report of district projections of yields
Estimated Yields Soybean Yield Corn Yield FBFM Adjusted Yields Crop Reporting District 2001 2002 2001 2002 Northwest 50 49 151 153 Northeast 48 44 149 142 West 50 50 159 162 Central 48 50 157 161 East 47 49 146 147 West Southwest 49 48 164 150 East Southeast 47 38 156 122 Southwest 40 33 137 85 Southeast 43 31 138 87 NASS Weighted Average 48 46 153 145 November 2002 NASS projections. Yields adjusted to represent differences between NASS and FBFM
Other Key Assumptions • Average increase in farm size 3.0% • Operating expenses adjustments from 2001 • Crop expenses - - 3% decrease (nitrogen cost) • Fuel and oil - - no change • All other expenses - - no change • Market value machinery and machinery depreciation – no change from 2001 • Average increase in land values 3.0% • Interest expense decrease 1% from 2001 (overall interest expense not rates)
1999 $31,248 2000 53,567 2001 29,686 2002 17,499 Estimate Net Farm Income Net farm income does not include: • Payments for operator labor/family withdrawals • Nonfarm income • Income taxes Actual
Net Farm Income $60,000 $50,000 $40,000 Dollars $30,000 $20,000 $10,000 $0 1997 1998 1999 2000 2001 2002* Year Net Farm Income 1997 - 2002 * Estimated
Sensitivity of Estimate Change in Average Income One bushel change in Corn yields Soybean yields Change in effective priceCorn price - $.05 Soybean price - $.10 $ 751 1,754 $ 2,304 1,398
Net Farm Income by Region Actual Projected
2002 Net Farm Income by Region $18,449 $17,969 $38,426 $39,351 -$534 $33,088 -$55,333 -$27,235
Change in Net Farm Income 2001 to 2002 -$930 -$451 $4,323 $11,368 -$44,029 $6,858 -$96,057 -$55,570
Distribution of Net Farm Income Distribution of Net Farm Incomes of 993 Illinois Grain Farms, 1999 - 2002 40% 36% 35% 33% 32% 29% 30% 28% 25% 22% 19% 19% 19% Percent of Farms 20% 18% 16% 16% 13% 12% 10% 7% 6% 5% 5% 3% 1% 1% 0% 0% Less Than - -50,000 to 0 0 to 20,000 20,000 to 50,000 50,000 to 100,000 Greater than 50,000 100,000 Net Farm Income 1999 2000 2001 2002
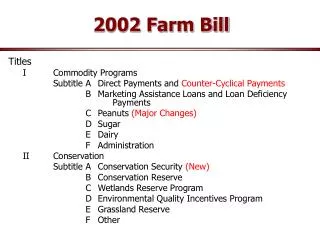
Effect of 2002 Farm Bill • Direct payments – guaranteed, based on base acres and program yields for each program crop. Replace AMTA payments. • Counter Cyclical payments – not guaranteed, based on 12 month national average price, and base acres and program yields. Institutionalize market loss assistance payments. • LDP’s, marketing loans– same as in the past, although we have different county loan rates. Available when PCP below loan rate.
Calculation of Direct Payments Corn Beans Wheat Per bu. rate $.28 $.44 $.52 x Program yield (bu.) 115 34 45 x Base acres 1 1 1 x .85 .85 .85 .85 = $27.37 $12.72 $19.89
Benefit of Proving SB Yield for Direct Payments Proven yield Plugged yield Per bu. rate $.44 $.44 x Program yield (bu.) 34 26 x Base acres 1 1 x .85 .85 .85 = $12.72 $ 9.72
Maximum Counter-Cyclical Payment Rate Higher of loan rate or season average price used in rate calculation
Counter Cyclical Payments Corn Beans Wheat Per bu. rate (max) $.34 $.36 $.54 x Program yield (bu.) 137 41 52 x Base acres 1 1 1 x .85 .85 .85 .85 = $39.59 $12.55 $23.87 Remember CC payments are not guaranteed!! Program yields equals 1998-01 state avg. x .935
Outlook for 2002 CC Payments CornSoybeansWheat Trigger price $2.32 $5.36 $3.34 12 month est. price for 2002* $2.40 $5.40 $3.80 2002 CC Payments?? 0 0 0 * Midpoint of Nov. 11 USDA Supply and Demand Report
Cash Flow/Income Considerations • Looking at significantly less total government payments this year. And no more payments until operators/landlords sign up for the program!! • Will be a “hole” in the cash flow. • Producers may need to consider more fall grain sales. Especially commercially stored grain. Save on storage costs. • Likely more price variability, marketing needs attention again!! • Income tax planning important, especially this year.
Loan deficiency payments 0 Significance of Government Payments Average Net Farm Income $ 17,499 Government Payments 14,952 Direct payments 14,952 Counter cyclical payments 0 LDP Assumptions Corn 0.00 Soybeans 0.00 Wheat 0.00
LDP and Market Loan Gains Market % Bu. Crop LDP Loan Receive Effective Year Payments Gain LDP or Gain Bu. Rate Corn 1999 $304,111,280 $42,256,320 88.6% $0.23 2000 $406,686,160 $23,794,260 93.3% $0.26 2001 $219,648,600 $10,770,390 90.1% $0.14 Soybeans 1999 $365,455,130 $25,874,100 98.4% $0.88 2000 $398,287,340 $32,709,100 99.5% $0.94 2001 $551,277,100 $28,560,970 98.2% $1.21 http://www.fsa.usda.gov/dafp/psd/reports.htm
Changes to Net Worth Net Income $17,499 - Family Living 49,429 + Nonfarm Income 23,881 - Income Taxes 11,771 -/+ Valuation Change 12,528 Total Change in Net Worth 2001 to 2002 -$7,292 • Assumptions: • 3.0% increase in land values • no change in machinery values
Annual Change Median 1998-99 4.43% 1999-00 5.25% 2000-01 1.16% 2001-02 -0.18% Change in Net Worth • Assumptions: • 3.0% increase in land values • no change in machinery values
Distribution of Net Worth Change Distribution of Net Worth Change for Illinois Grain Farms 50% 45% 45% 45% 40% 40% 39% 40% 34% 35% 30% 24% 25% 22% 20% 20% 18% 15% 12% 9% 10% 9% 8% 7% 6% 6% 4% 5% 4% 2% 3% 2% 1% 1% 0% < -30% -30% to -10% -10% to 0% 0% to 10% 10% to 30% > 30% 1998-99 1999-00 2000-01 2001-02
Simple Risk Rating Model Positive Working Capital (Current Ratio greater than 1) Rate of Return on Equity (before depreciation) Less Than Greater Than Debt to Asset Ratio -20% -20% to -5% -5% to 5% 5% to 20% 20% 0 to 10% Vulnerable Vulnerable Stable Strong Strong 10% to 40% Vulnerable Vulnerable Stable Strong Strong 40% to 70% Vulnerable Vulnerable Vulnerable Stable Stable 70% to 100% Vulnerable Vulnerable Vulnerable Vulnerable Vulnerable Greater than 100% Severe Severe Severe Severe Severe Negative Working Capital (Current Ratio less than 1) Rate of Return on Equity (before depreciation) Less Than Greater Than Debt to Asset Ratio -20% -20% to -5% -5% to 5% 5% to 20% 20% 0 to 10% Stressed Stressed Vulnerable Stable Stable 10% to 40% Stressed Stressed Vulnerable Stable Stable 40% to 70% Stressed Stressed Stressed Vulnerable Vulnerable 70% to 100% Stressed Stressed Stressed Stressed Stressed Greater than 100% Severe Severe Severe Severe Severe
Financial Position Distribution of Illinois Grain Farms by Financial Position Category, 1999-2002 60% 49% 50% 47% 47% 40% 40% 1999 2000 2001 29% Percent of farms 30% 2002 21% 21% 21% 20% 18% 20% 16% 15% 16% 15% 13% 10% 10% 0% 0% 0% 0% 0% Strong Stable Vulnerable Stressed Severe Financial Position
What commodity price levels are needed if government payments are eliminated? • To achieve Net Farm Income of $21,046 with 2002 estimated yields Commodity prices would need to increase to Corn $2.69 Soybeans $5.92 Wheat $3.45 • To achieve Net Farm Income of $50,000 with 2002 estimated yields Commodity prices would need to increase to Corn $3.06 Soybeans $6.74 Wheat $3.92
Conclusions and Limitations • Many assumptions made in study • Sensitivity of projections to prices • Grain farms only, no livestock returns • 2002 incomes projected lower than 2001 • Much more variability in income around the state, southern Illinois hurt the most • Government program payments have less of an impact on income as compared to the last few years • In general, financial health remaining stable