Download

1 / 13
130 likes | 227 Vues
The Wealth of Nations: A study of Political Institutions and Economic Growth. Tower Center Research Project Kathryn Gotcher, Kyle Merino, Greg Moran May 6, 2009. Problem: Are there national institutions linked to government policies that encourage economic health in a given country?.

E N D
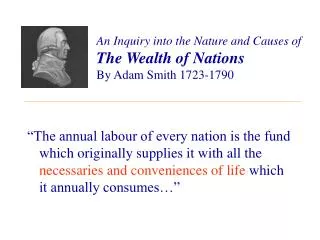
The Wealth of Nations: A study of Political Institutions and Economic Growth Tower Center Research Project Kathryn Gotcher, Kyle Merino, Greg Moran May 6, 2009
Problem: Are there national institutions linked to government policies that encourage economic health in a given country? • Project evolved from previous work done by Dr. Thomas Siems • Important due to the state of global economy • 4 key questions • Could we reasonably determine factors that contribute to the economic health of a country? • Are there rational groups that our countries could be divided into in terms of economic health? • Which factors weigh most heavily in determining the division of the groups of countries? • Are the results statistically significant?
Analysis: Use straightforward approach to alleviate problems foreseen in the study • Approach • Identify possibly significant data variables • Build model to group countries for further study • Find statistical analysis method to evaluate significance of results • Problems • Inability to use every possible contributing variable • Unavailability of data for some countries
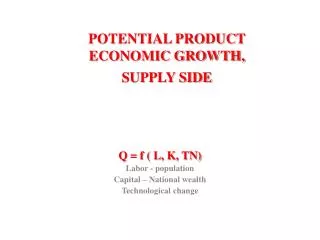
Our model used 8 variables to group 126 countries for analysis of economic health Modeling Variables and Sources * All data collected from 2006 observations
The first model used was a neural network clustering algorithm called self organizing maps • Excel-based software • 2 phases • Training • Mapping • Neurons associated with weight vector and position in grid • Data vectors relative distance computed and matched with closest neuron Simplified SOM Example
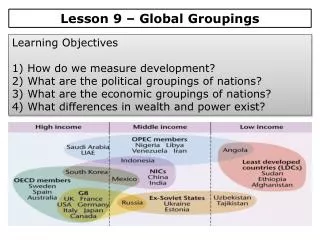
Clustering provided groups that were effectively classified into 3 levels of economic health • Cluster 3 represents healthiest countries • Cluster 4 represents middle countries • Clusters 1 & 2 combined as least healthy countries Clustering Output Random Sampling of Clusters
We compared clusters on multiple other measures of economic health and other political institutions • Almost all graphs confirmed cluster classification • Compared on GDP per capita, GDP growth and volatility, economic sectors, regulations, savings, fertility, unemployment, urbanization, and life expectancy • One outlier- Mostly healthy countries had lower savings rate than partially healthy countries • Possibly due to use of credit in healthy countries
The second model used was a data envelopment analysis algorithm Simplified DEA Example • Establishes certain countries as the “most efficient frontier” • Then peels off outer layer and repeats the process • Effective way to rank individual countries • DEA PIONEER v.2.0 - Open source software developed by Richard Barr
The DEA model grouped the 126 countries into 13 levels Random Sampling from DEA Levels • Confirmed clusters generated by SOMs • Each level had 3-14 countries in it
Individual rankings were also generated from the DEA software DEA Rankings and Values of Sampled Countries
Multiple Linear Regression was used to determine significance of variables Determined that best linear equation for GDP per Capita was : GDP per Capita= -18,024.5 +3,802.99(CPI) +18,565.83(HDI) Various MLR models- Coefficients and T-Stats
Correlational values of variables suggest link between CPI and HDI and a strong legal system MLR Variable Correlations
Overall, the project was a success and generated many new areas for study • Recommendations • Policy makers should focus on lowering corruption in the system and creating opportunities for citizens to be healthy, educated, and prosperous • One possible way to do this would be strengthening the legal system • Further Areas of Study • Causal Relationship between CPI/HDI and legal system • Use of regression output to formulate DEA weights • Use of other DEA outputs in model