Download
1 / 39
390 likes | 516 Vues
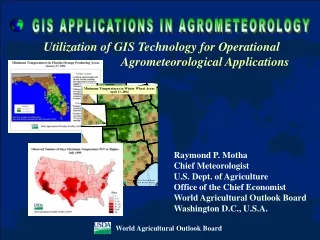
World Agricultural Outlook Board Interagency Commodity Estimates Committee Forecasts. Lockup Briefing April 9, 2014. World Wheat Production. World Wheat Supply and Use. World Corn and Wheat Exports Trade Years*. *Corn trade year October-September. Wheat trade year July-June.

E N D
World Agricultural Outlook BoardInteragency Commodity Estimates Committee Forecasts Lockup Briefing April 9, 2014
World Wheat Production April 9, 2014
World Wheat Supply and Use April 9, 2014
World Corn and Wheat ExportsTrade Years* *Corn trade year October-September. Wheat trade year July-June. Source: USDA-FAS, Office of Global Analysis, Grains:World Markets and Trade, March 10, 2014 April 9, 2014
U.S. Wheat Supply and Demand April 9, 2014
World Rice Production April 9, 2014
World Rice Supply and Use April 9, 2014
U.S. Rice Supply and DemandRough Equivalent of Rough and Milled Rice April 9, 2014
World Corn Production April 9, 2014
Brazil 2013/14 Corn SummaryApril 2014 *Indicates a record April 9, 2014
Brazil Corn: First-season compared to Second-season First-season Corn Second-season Corn Planting began in Feb. 2014. High cost of production and low prices result in unprofitability. Area down 0.7 Mhafrom last year. Rains in Parana, Mato Grosso do Sul, Goias and Mato Grosso have increased yield potential. Corn production for export market. • Planting began in September 2013. • Area down 0.4 Mha from last year. • Crop is harvested. • Some damage from heat and drought. • Corn production used by livestock industry. April 9, 2014
Agricultural Weather Assessments World Agricultural Outlook Board Average 2012/13 2013/14 Since Last Meeting 2nd Corn (DERAL) 99% Planted Mar 30: 82% vegetative 14% flowering 3% filling 92% Good / 1% Poor April 9, 2014
1 2 3 April 9, 2014
Second-crop corn 3. Toledo, Parana, Brazil Satellite-derived vegetation health indicates conditions for 2013/14 (RED) are similar to 2012/13 season (YELLOW) for corn in Parana. Corn yields are forecast similar to last year’s 4.83 tons per hectare. Critical flowering and grainfill stages for second-crop corn are expected in late April and early May. April 9, 2014
South Africa’s Grain Basket Approximately 50% of production is divided between east and west. East: Higher yields & less corn area West: Lower yields & greater corn area Gautang North West Mpumalanga Free State April 9, 2014
Lower Yields in the West Lower yields in the west due to lower rainfall and low plant density from wide row spacings (>1.5-meters). April 9, 2014 16
Monthly Actual Evapotranspiration (ETa) AnomalyDerived from Thermal Band on MODIS sensor Percent of Average (2001-2010) Mar, 2014 Feb, 2014 Dec, 2013 Jan, 2014 Source: FEWSNET/USGS Africa: http://earlywarning.usgs.gov/adds/africa/index.phpGlobal: http://earlywarning.usgs.gov/fews/global/index.php April 9, 2014 17
Agricultural Weather Assessments World Agricultural Outlook Board 2013/14 Average 2012/13 April 9, 2014
North West Province: MODIS-NDVI Time Series April 9, 2014 Source: USDA/NASA GLAM Project http://glam1.gsfc.nasa.gov/ 19
Latest trend is to install center pivots (CP) with smaller diameters. April 9, 2014
World Corn Supply and Use April 9, 2014
U.S. Corn Supply and Demand April 9, 2014
World Soybean Production April 9, 2014
Brazil 2013/14 Soybean SummaryApril 2014 *Indicates a record April 9, 2014
Hot and dry in early February 2014. About 40 percent of production. April 9, 2014
U.S. Soybean Supply and Demand April 9, 2014
World Cotton Production April 9, 2014
World Cotton Supply and Use April 9, 2014
U.S. Cotton Supply and Demand April 9, 2014
Mexico Sugar Supply and Demand April 9, 2014
U.S. Sugar Supply and Demand April 9, 2014
U.S. Meat Production and Prices April 9, 2014
U.S. Meat TradeMillion Pounds April 9, 2014
U.S. Milk Supply and Demand April 9, 2014
U.S. Dairy Product Prices April 9, 2014
U.S. Production Summary April 9, 2014
Domestic Demand Summary April 9, 2014
U.S. Export Summary April 9, 2014
Price Summary April 9, 2014