Download
1 / 21
210 likes | 223 Vues
The duality between exergy efficiencies and exergy costs. A general theory and the Relative Free Energy function. Antonio Valero, CIRCE – Instituto de Investigación en Recursos y Consumos Energéticos. University of Zaragoza (Spain). Motivation.

E N D
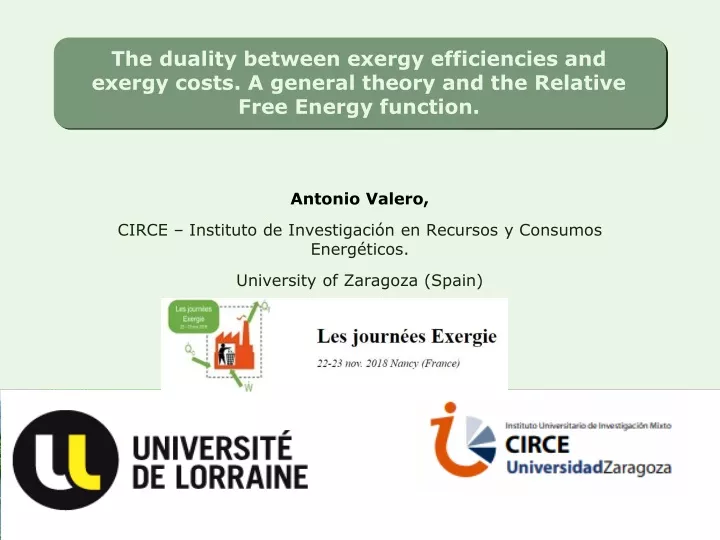
The duality between exergy efficiencies and exergy costs. A general theory and the Relative Free Energy function. Antonio Valero, CIRCE –Instituto de Investigación en Recursos y Consumos Energéticos. University of Zaragoza (Spain)
Motivation • Costing is one of the most important applications of exergy. Exergy allows more precise allocations than energy or even money when two or more stream bifurcations appear in energy systems. • Exergy cost analysis has become a complementary analysis of energy systems. However, such analyses strongly depend on the practitioner expertise. • A number of “reasonable” decisions need to be taken to get fair results. • “This paper focus on developing a mathematical theory that support such decisions but also to analyze the pitfalls or weaknesses of conventional exergy costing” A general theory and the Relative Free Energy function.
Motivation • Costing is one of the most important applications of exergy. Exergy allows more precise allocations than energy or even money when two or more stream bifurcations appear in energy systems. • Exergy cost analysis has become a complementary analysis of energy systems. However, such analyses strongly depend on the practitioner expertise. • A number of “reasonable” decisions need to be taken to get fair results. • “This paper focus on developing a mathematical theory that support such decisions but also to analyze the pitfalls or weaknesses of conventional exergy costing” ApplyingThermoeconomics to the Analysis of North American Food Chain
Motivation • The Global 2000 Report (Barney, 1980) presented a flow diagram of energy form American food production. • For some 3.6 GJ (per capita/year) of human food energy, 35.5 GJ of fossil fuel energy have been expended, not counting the “solar gift” of 80 GJ that is absorbed by the plants used in the process. • It seems more than plausible that the energy “demand” from agriculture and food processing can be reduced dramatically with essentially no sacrifice of wellbeing. Applying Thermoeconomics to the Analysis of North American Food Chain
Objectives • How much fossil fuels can be saved if we recycling crop residues? • How much fossil fuels and harvest area could be saved if we improve the efficiency of vegetal and animal production processes? • How much fossil fuels and harvest area could be saved if we change our diet and consume more vegetables and less meat? • How food demand could be increasing according to increasing population? • How this kind of questions could be answered using Thermoeconomics? Applying Thermoeconomics to the Analysis of North American Food Chain
Vegetal Biomass Production Harvest Production Animal Food Production Vegetal Food Production Human Food Demand 1 80 2 3 1 4 60 5 7 3 2 5 3.5 51.5 5 4 15 13.5 1.9 3.1 3.6 The Fuel Product Diagram Applying Thermoeconomics to the Analysis of North American Food Chain
The Fuel-Product Table Applying Thermoeconomics to the Analysis of North American Food Chain
The Fuel-Product Table • The fuel product table is the matrix representation of the productive process in terms of useful energy. • Each element Eijrepresents the production of the process –i– that becomes resources of the process –j–, measure in terms of useful energy. (Fuel) (Product) (System Resources) (System Demand) Applying Thermoeconomics to the Analysis of North American Food Chain
The Demand Driven Model • The demand driven model allow to determine the system resources cost as a function of: • The production demand: • The efficiency of each process: • The junction ratios: • The resources required in each process could be obtained as: • The cost per production unit could be obtained as: Applying Thermoeconomics to the Analysis of North American Food Chain
The Resources Driven Model • The resources driven model allow to determine the system production and their costs as a function of: • The system resources: • The efficiency of each process: • The distribution ratios: • The resources required in each process could be obtained as: • The production cost could be obtained as: Applying Thermoeconomics to the Analysis of North American Food Chain
The Exergy Cost Input-Output Table • The Exergy Cost Input-Ouput table is the matrix representation of a production process in terms of exergy cost, i.e. the system resources, measured in term of exergy Cij, required to obtain a internal or final product of the process. Properties Applying Thermoeconomics to the Analysis of North American Food Chain
Food Chain Base Case • The graph shows the biomass and fossil fuels required to obtain one unit of product for each process on the USA Food Chain. • To produce 1 Kcal of meat we need more than 10 Kcal of fossil fuels, meanwhile to produce a kcal of vegetable food we need only 5 Kcal of fossil fuels. • The exergy cost analysis lets to identify the most inefficient processes in order to improve them. Applying Thermoeconomics to the Analysis of North American Food Chain
Exergy Cost Input-Output Table Applying Thermoeconomics to the Analysis of North American Food Chain
Question 1: Recycling Biomass • What happen if we recycling 10% of crop residues (2 GJ), keeping the imports and human consumption constant? • The graph show the results to apply the “Resources Driven Model” to simulate a reduction of 2 GJ of the fossil fuel consumption of the harvest production (E02= 5) and an increase of the efficiency of the vegetal biomass production • It shows than the unit cost of human food production in terms of fossil fuels is reduced in a 5,6%. Applying Thermoeconomics to the Analysis of North American Food Chain
Question 2: Process Efficiency Analysis • What happen if the efficiency of each individual process is improving a 10%? • The graph shows the result to apply the “Demand driven Model” to this simulation, by increasing the efficiency of each individual process • It show that improving the efficiency and reducing the losses on the last stages of the human food production process, the most important fossil fuels savings are obtained. Applying Thermoeconomics to the Analysis of North American Food Chain
Question 3: Changes in Food Diet • What happen if the consumption of meat is reduced in 10% percent, maintaining the final demand of energy per person? • The graph shows the result to apply the “Demand driven Model” to this simulation, by modifying the junction ratios of the last process. • It shows that a change of diet implies a saving of 13.42% of biomass resources and 5.73% of fossil fuels Applying Thermoeconomics to the Analysis of North American Food Chain
Question 4: Increasing Population • The USA population has been increased 10% in the last 10 years. • What happen if population increase a 1% every year? Of course the energy consumption of energy both biomass and fossil fuels increase 1%. And what happen if the biomass energy free supplied by the sun, that is equivalent to the harvest area, could not increase? • A simulation using the fuel-product model is shown, where the energy food demand is increase 1%, by keeping constant the biomass supply, and modifying the imports. • A reduction of 8.9% in the imports is required with a increase of 0.25% in the fossil fuel consumption. Applying Thermoeconomics to the Analysis of North American Food Chain
Question 4: Increasing Population Fuel-Product table comparison for increasing food demand in 1% keeping constant the biomass supply. Applying Thermoeconomics to the Analysis of North American Food Chain
Conclusions • We are shown the capabilities of Thermoeconomics as a tool for the analysis of macroeconomics energy and environmental systems, by applying this methodology to the analysis of the food chain. • It has been shown that an animal-based diet requires more energy, land and another natural resources than plant-based diet. Reducing the meat consumption in 10% but supplying the same calories, reducing the fossil fuel consumption in 6% and land requirements in 13.5%. • Recycling biomass appears as an important fossil fuel saving. If we recycling 10% of the crop waste, we reduced the total fossil fuel consumption in 5.6%. • We should take care about the efficiency of last food production stages. An increasing of 10% provides 7% of fossil fuel saving. Applying Thermoeconomics to the Analysis of North American Food Chain
Conclusions • Thermoeconomics is a general theory of energy saving based on Second Law analysis that has been commonly used in the analysis of power a chemical plant since the 70’s. • We have demonstrated that Thermoeconomics and in particular Symbolic Exergoeconomics could be applied to a wider variety of energy and environmental systems in order to simulate and evaluate energy saving policies. • The methodology presented here could be considered as an extension of the economic input-output analysis called “Exergy Input-Output Analysis”. Applying Thermoeconomics to the Analysis of North American Food Chain
Thank you very much for your attention! Applying Thermoeconomics to the Analysis of North American Food Chain