Download
1 / 26
260 likes | 265 Vues
Fun Size Your Data: Using Statistical Techniques to Efficiently Compress and Exploit Benchmarking Results David J. Lilja Electrical and Computer Engineering University of Minnesota lilja@umn.edu. The Problem. Benchmark programs. Heaps o’ data 445 446 397 226 388 3445 188 1002

E N D
Fun Size Your Data: Using Statistical Techniques to Efficiently Compress and Exploit Benchmarking Results David J. Lilja Electrical and Computer Engineering University of Minnesota lilja@umn.edu
The Problem Benchmark programs Heaps o’ data 445 446 397 226 388 3445 188 1002 47762 432 54 12 98 345 2245 8839 77492 472 565 999 1 34 882 545 4022 827 572 597 364 … • We can generate heaps of data • But it’s noisy • Too much to understand or use efficiently
A Solution • Statistical design of experiments techniques • Compress complex benchmark results • Exploit the results in interesting ways • Extract new insights • Demonstrate using • Microarchitecture-aware floorplanning • Benchmark classification
Why Do We Need Statistics? • Draw meaningful conclusions in the presence of noisy measurements • Noise filtering • Aggregate data into meaningful information • Data compression Heaps o’ data 445 446 397 226 388 3445 188 1002 47762 432 54 12 98 345 2245 8839 77492 472 565 999 1 34 882 545 4022 827 572 597 364 …
Why Do We Need Statistics? • Draw meaningful conclusions in the presence of noisy measurements • Noise filtering • Aggregate data into meaningful information • Data compression Heaps o’ data 445 446 397 226 388 3445 188 1002 47762 432 54 12 98 345 2245 8839 77492 472 565 999 1 34 882 545 4022 827 572 597 364 …
Design of Experiments for Data Compression • Effects of each input • A, B, C • Effects of interactions • AB, AC, BC, ABC 445 446 397 226 388 3445 188 1002 47762 432 54 12 98 345 2245 8839 77492 472 565 999 1 34 882 545 4022 827 572 597 364 …
Types of Designs of Experiments • Full factorial design with replication • O(vm) experiments = O(43) • Fractional factorial designs • O(2m) experiments = O(23) • Multifactorial design (P&B) • O(m) experiments = O(3) • Main effects only – no interactions • m-factor resolution x designs • k O(2m) experiments = kO(23) • Selected interactions
Example: Architecture-Aware Floor-Planner V. Nookala, S. Sapatnekar, D. Lilja, DAC’05.
Layout wire Motivation • Imbalance between device and wire delays • Global wire delays > system clock cycle in nanometer technology
Layout FF wire Solution • Wire-pipelining • If delay > a clock cycle → insert flip-flops along a wire • Several methods for optimal FF insertion on a wire • Li et al. [DATE 02] • Cocchini et al. [ICCAD 02] • Hassoun et al. [ICCAD 02] • But what about the performance impact of the pipeline delays?
Impact on Performance Execution time = num-instr * cycles/instr (CPI) * cycle-time Wire-pipelining
Impact on Performance Execution time = num-instr * cycles/instr (CPI) * cycle-time • Key idea • Some buses are critical • Some can be freely pipelined without (much) penalty Wire-pipelining
Change Objective Function Execution time = num-instr * cycles/instr (CPI) * cycle-time • Traditional physical design objectives • Minimize area, total wire length, etc. • New objective • Optimize only throughput critical wires to maximize overall performance Wire-pipelining
Conventional Microarchitecture Interaction with Floor Planner Simulation Methodology µ-arch Benchmarks CPI info Physical Design Frequency
Microarchitecture-aware Physical Design Simulation Methodology µ-arch Benchmarks CPI info Physical Design Frequency Layout • Incorporate wire-pipelining models into the simulator • Extra pipeline stages in processor • Simulator needs to adjust operation latencies
But There are Problems Simulation Methodology µ-arch Benchmarks CPI info Physical Design Frequency Layout • Simulation is too slow • 2000-3000 instructions per simulated instruction • Numerous benchmark programs to consider • Exponential search space • Thousands of combinations tried in physical design step
# Simulations is linear in the number of buses (if no interactions) Design of Experiments Methodology Design of Experiments based Simulation Methodology µ-arch benchmarks MinneSPEC Reduced input sets Bus, interaction weights benchmarks Floorplanning Validation Frequency Layout
Related Floorplanning Work • Simulated Annealing (SA) • CPI look up table [Liao et al, DAC 04] • Bus access ratios from simulation profiles • Minimize the weighted sum of bus latencies [Ekpanyapong et al, DAC 04] • Throughput sensitivity models for a selected few critical paths • Limited sampling for a large solution space [Jagannathan et al, ASPDAC 05] • Our approach • Design of experiments to identify criticality of each bus
Microarchitecture and factors IADD1 • 22 buses → 19 factors in experimental design • Some factors model multiple buses IADD2 RUU IADD3 Fetch Decode REG IMULT LSQ BPRED FADD DL1 DTLB IL1 FMULT ITLB L2
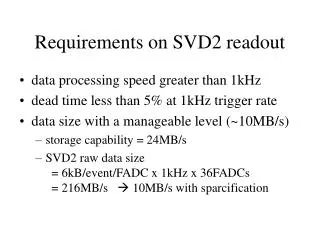
2-level Resolution III Design • 2-levels for each factor • Lowest and highest possible values (range) • Latency range of buses • Min = 0 • Max = Chip corner-corner wire latency • 19 factors 32 simulations (nearest power of 2) • Captured by a design matrix (32x19) • 32 rows - 32 simulations • 19 columns - Factor values
Experimental setup • Nine SPEC 2000 benchmarks • MinneSPEC reduced input sets • SimpleScalar simulator • Floorplanner -- PARQUET • Simulated annealing based • Objective function Minimize the weighted sum of bus latencies • Secondarily minimize aspect ratio and area
Averaged Over All Benchmarks • Compared to acc • 3-7% point improvement • Better improvements over acc at higher frequencies • SFP-comb≈ SFP (within about 1-3% points)
Summary • Use statistical design of experiments • Compress benchmark data into critical bus weights • Used by microarchitecture-aware floorplanner • Optimizes insertion of pipeline delays on wires to maximize performance • Extend methodology for other critical objectives • Power consumption • Heat distribution
Collaborators and Funders • Vidyasagar Nookala • Joshua J. Yi • Sachin Sapatnekar • Semiconductor Research Corporation (SRC) • Intel • IBM