Download
1 / 53
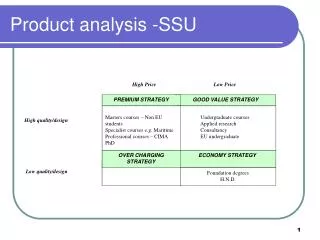
530 likes | 534 Vues
Product and Equipment Analysis. Chapter 2. Data required for developing good layouts. Product Analysis Process Analysis. Input Data and Activities. What data are critical to the facility plan? Muther categorizes the information as: P – Product (what?) Q – Quantity (how much?)

E N D
Product and Equipment Analysis Chapter 2
Data required for developing good layouts • Product Analysis • Process Analysis
Input Data and Activities • What data are critical to the facility plan? • Muther categorizes the information as: P – Product (what?) Q – Quantity (how much?) R – Routing (where?) S – Support (with what?) T – Timing (when?)
Product Analysis • Bill of Materials • Assembly Charts • Engineering Drawing • Operation Process Chart • Route Sheet • QFD product development • TRIZ • CAD/CAM
Input Data and Activities • Tompkins, White, et. al., categorize it as: Product Design – what is to be produced? Process Design – how is it to be produced? Schedule Design – when and how much? Product Facility Schedule Process
Product Design • Based on • Function • Aesthetics • Costs • Materials • Manufacturing Methods • Key point • The product design MUST be finalized before designing the facility. Otherwise a flexible facility is needed. Driven by market demand
Tools Used in Product Design • Product/Part Drawings • 2-D, 3-D visualization • Exploded Assembly Diagrams
Tools Used in Process Design A partial list (dependent on product and service): • Process Flowcharts and Process Maps • Make vs. Buy • Parts Lists • Bill of Materials • Route Sheets • Assembly Charts • Operations Process Charts • Precedence Diagrams
UPS Active Bins Parcel Post Picking Packing Receiving Shipping Reserve Storage Mono-gramming Next-Day UPS Embroid-ering Quality Assurance Back to Vendor Hemming Gift Boxing Process Flowcharts
Is order complete? Prepare soup or salad order Give order to waiter Process Maps Customer Waiter Salad Chef Dinner Chef N Place order Y Give soup or salad order to chef Prepare dinner order Give dinner order to chef Drink Get drinks for customer Eat salad or soup Deliver salad or soup order to customer Give order to waiter Deliver dinner to customer Eat dinner Receives check Deliver check to customer Gives payment to waiter Receive payment for meal Credit Cash or Credit? Cash Collect change, leave tip Bring change to customer Run credit card through Fill in tip amount Return credit slip to customer Collect tip
Make vs. Buy? BUY No Is it cheaper for us to make? Yes Can we make the item? Yes Yes Can item be purchased? Is the capital available? No No Yes No MAKE BUY BUY MAKE
Parts List • A listing of component parts.
Bill of Materials • Many different types of “structured parts lists”
Route Sheet Company: ARC Inc. Produce: Air Flow Regulator Part: Plunger Housing Part No. 3254 Prepared by: JSU Part No. 6/6/03
4150 3250 2200 3254 3253 3251 A-4 3252 4250 A-1 SA-1 A-2 A-3 3255 Assembly Chart • Analog model of the assembly process. • Circles denote components • Links denote operations/subassemblies • Squares represent inspections operation • Begin with the original product and to trace the product disassembly back to its basic components. I-1 1050 Pack
9 3 5 6 7 10 8 12 11 Assembly Charts 1 4 2
Found by superimposing the route sheets and the assembly chart, a chart results that gives an overview of the flow within the facility. Operations Process Chart
Production Requirements – Yield Loss Pi – Production input to operation i si – Fraction of Pi lost (scrap) Oi– output of process i i Pi Oi Pisi
Production Requirements – Series Systems . . . 1 2 n P1 On Pnsn P1s1 P2s2
Example • 5 processes in series • Need 2000 units out
3 M2 M1 M4 M3 s5=4% s1=1% s3=2% s4=1% 1 M2 s2=2% 2 4 5 Production Requirements – Non Series Part B Part A Work backward from end of the line. 100,000 units
Simple equipment selection model • P desired prod rate • t time (in hours) to process one part • m/c avail time (in hours) • m/c efficiency
Simple equipment selection model • Nol Number of good units at output of stage l • Nil Number of units reqd at input of stage l • Sl Scrap at stage l
Simple example 1. Consider a simple job shop manufacturing system that makes three major “Class A” products requiring three types of machines. The three products include seven parts shown in Table 2.1. Table 2.1 also shows the time standards in units per hour. 2. Assume an hour has only 55 minutes of productive time and that 5 minutes are lost due to operator or machine unavailability and machine downtime. 3. Dividing the value 55 by the values in Table 2.1, we get the as well as time per unit. 4. Determine the quantities of machines of each type required to make the standard time per unit. 5. Assuming 12000 “representative” parts are to be made and that only 440 minutes of productive time is available per shift, we can find that we need 12000*0.1799/440= 4.9 units of machine A, 5.85 units of machine B, and 4.3 units of machine C. • Rounding up these numbers gives us 5, 6, and 5 units of machine types A, B, and C, respectively.
Calculating Equipment Requirements How many pieces of equipment do we need? Pi Production rate for operation i (pcs/period) Ti Time per piece for operation i (time/pc) Ci Time available to run operation i (time/period) Ei Efficiency of machine while running Ri Reliability of machine Mj Number of type j machines required xj Set of operations run on machine j
Example • Consider Machine 2 • x2={2,3} • Do similar calculation for other machines • Other factors to consider • Number of shifts • Setup times • Customer lot sizes (smaller require more setups) • Layout type • Maintenance activities
Operator-Machine Charts • Tool for showing activity of both operator and machine along a time line • Also called “multiple activity chart” Example: 1 minute to load 1 minute to unload 6 minute run cycle 0.5 minute to inspect and pack 0.5 minute to travel to another machine
Parameters for an LP equipment selection model • Oi Operation type i, i=1,2,...,o • Mi Production equipment type i, i=1,2,...,m • Pi Part type i, i=1,2,...,p • MHi Material handling system type i, i=1,2,...,n • cij cost of performing operation Oi on production equipment type Mj • hij cost of handling part type Pi using material handling system type MHj • tij time required to perform operation Oi on production equipment type Mj • sij time required to transport part type Pi using material handling carrier type MHj • τj time available on production equipment type Mj • σj time available on material handling carrier type MHj • NOi number of operations Oi to be performed • NPi number of units of part type Pi to be manufactured • Cj cost of production equipment type Mj • Hj cost of material handling system MHj • B total budget available
Decision Variables for LP equipment selection model • xij number of operations Oi to be performed on production equipment type Mj • yij number of units of part type Pi to be transported on material handling system type MHj • NMj number of units of production equipment type Mj selected • NMHjnumber of units of material handling system type MHj selected • MIDTERM,May3rd
LP equipment selection model • Min • Subject to
Example An automobile engine cylinder manufacturing company that supplies high precision engines to a multinational car manufacturer plans to manufacture several models of cylinder. For planning purposes, it uses the following pseudo products - a standard(basic) engine cylinder, a high-technology model, an engine cylinder for sports cars and a luxury car cylinder. The marketing department has demand forecast figures which have been aggregated for the four pseudo models. It has been determined that 2000, 1500, 1800 and 1000 units of the basic, high-tech, sports and luxury models will be demanded during the next six months.
Example The models require one or more of three operations, referred to as O1, O2, and O3. Three machine types and two material handling systems available for performing the three operations and transporting the models. These are denoted as M1, M2, M3 and MH1, MH2, respectively. Each machine and handling system may be assumed to be available for 90 percent of the time. The cost of machines M1, M2, and M3 are $230,000; $250,000; $310,000. The number of operations needed of each machine is 200,200 and 150 respectively. The cost of material handling carriers MH1, MH2 are $90,000 and $130,000 The available budget is $10,000,000. The following two matrices show the cij's and hij's - that is, the cost of performing operation Oi on production equipment type Mj and cost of handling part type Pi using material handling system type MHj, respectively. (Units/ 10 unit time)
LP Model for example • MIN 90000 NMH1 + 130000 NMH2 + 230000 NM1 + 250000 NM2 • + 310000 NM3 + 6 X11 + 12 X12 + 8 X13 + 4 X21 + 5 X22 • + 4 X23 + 12 X31 + 5 X32 + 5 X33 + 10 Y11 + 5 Y12 + 12 Y21 • + 6 Y22 + 18 Y31 + 9 Y32 + 6 Y41 + 3 Y42 • SUBJECT TO • C1) X11 + X12 + X13 >= 200 • C2) X21 + X22 + X23 >= 200 • C3) X31 + X32 + X33 >= 150 • C4) - 300 NM1 + 1.67 X11 + 2.5 X21 + 0.83 X31 <= 0 • C5) - 300 NM2 + 0.833 X12 + 2 X22 + 2 X32 <= 0 • C6) - 300 NM3 + 1.25 X13 + 2.5 X23 + 2 X33 <= 0 • C7) Y11 + Y12 >= 2000 • C8) Y21 + Y22 >= 1500 • C9) Y31 + Y32 >= 1800 • C10) Y41 + Y42 >= 1000 • C11) – 300 NMH1 + 0.1 Y11 + 0.0833 Y21 + 0.056 Y31 + 0.167 Y41 <= 0 • C12) - 300 NMH2 + 0.2 Y12 + 0.167 Y22 + 0.11 Y32 + 0.33 Y42 <= 0 • C13) 90000 NMH1 + 130000 NMH2 + 230000 NM1 + 250000 NM2 • + 310000 NM3 <= 1000000 • END • GIN 5
LP Model Solution • VARIABLE VALUE REDUCED COST • NMH1 2.000000 90000.000000 • NMH2 .000000 105454.546875 • NM1 2.000000 228562.875000 • NM2 1.000000 248353.593750 • NM3 .000000 308353.593750 • X11 200.000000 .000000 • X12 .000000 2.571524 • X13 .000000 .860030 • X21 59.880245 .000000 • X22 140.119751 .000000 • X23 .000000 1.744012 • X31 140.119751 .000000 • X32 9.880246 .000000 • X33 .000000 .000000 • Y11 2000.000000 .000000 • Y12 .000000 11.363637 • Y21 1500.000000 .000000 • Y22 .000000 7.663636 • Y31 1800.000000 .000000 • Y32 .000000 .000000 • Y41 1000.000000 .000000 • Y42 .000000 24.000002
Parameters for LP equipment selection model • rik number of times operation Oi is to be performed on part type Pk • cijk cost of performing operation Oi using production equipment type Mj on part type Pk • tijk time required to perform operation Oi using production equipment type Mj on part type Pk • xijk number of units of operation Oi performed using production equipment type Mj on part type Pk • Cj purchase cost of production equipment type Mj prorated over the planning period
LP equipment selection model • Min • Subject to
Queuing Model Manufacturing engineers at the Widget Manufacturing Company recently convinced their manager to purchase a more expensive, but flexible machine that can do multiple operations simultaneously. The rate at which parts arrived at the machine that was replaced by the flexible machines follows a Poisson process with a mean of 10 parts per hour. The service rate of the flexible machine is 15 parts per hour compared with the 12 units per hour service rate of the machine it replaced. (All service times follow an exponential distribution.)
Queuing Model The engineers and manager were convinced that the company would have sufficient capacity to meet higher levels of demand, but just after a two months of purchasing the machines it turned out that the input queue to the flexible machine was excessively long and part flow times at this station were so long, that the flexible machine became a severe bottleneck. The engineers noticed that more parts were routed through this machine, and that the parts arrival rate to the flexible machines had increased from 10 per hour to about 14 per hour, but were puzzled why the part flow time at this station doubled from 30 minutes to one hour and the work-In-process (WIP) inventory increased nearly threefold from 5 to 14 when the arrival rate only increased 40%. Use a queuing model to justify the results observed at Widget Manufacturing Company.
Personnel requirements analysis • n number of types of operations • Oi aggregate number of operation type i required on all the pseudo (or real) products manufactured per day • Ti standard time required for an average operation Oi • H total production time available per day • η assumed production efficiency of the plant