Download
1 / 53
530 likes | 538 Vues
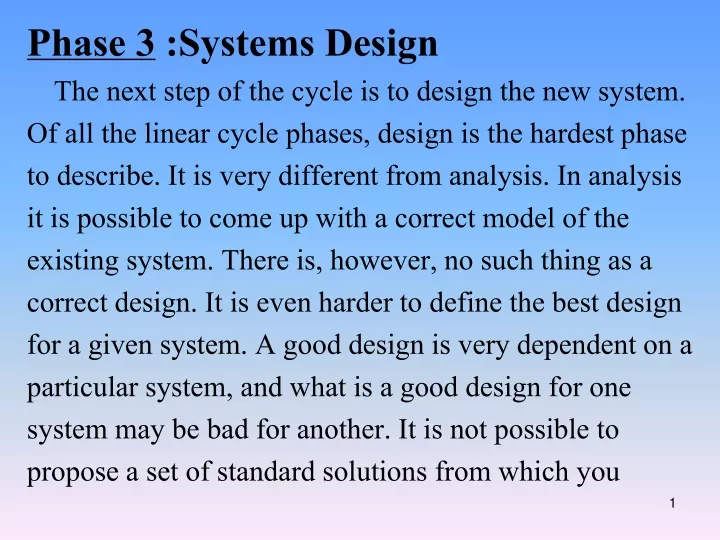
Phase 3 : System s Design The next step of the cycle is to design the new system. Of all the linear cycle phases, design is the hardest phase to describe. It is very different from analysis. In analysis it is possible to come up with a correct model of the

E N D
Phase 3 :Systems Design The next step of the cycle is to design the new system. Of all the linear cycle phases, design is the hardest phase to describe. It is very different from analysis. In analysis it is possible to come up with a correct model of the existing system. There is, however, no such thing as a correct design. It is even harder to define the best design for a given system. A good design is very dependent on a particular system, and what is a good design for one system may be bad for another. It is not possible to propose a set of standard solutions from which you
can select a good design for any system. Instead, design requires considerable creativity to make the necessary system-specific changes and additions and come up with a new system that is acceptable to users and easy to implement. Output design During The systems design phase, we design an information system that satisfies the requirements that were specified in the system requirements document during the system analysis phase. Next, we discuss design techniques and strategies
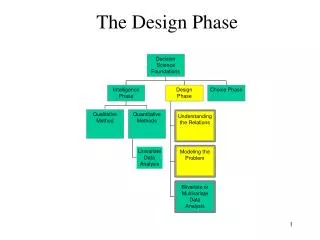
for the output component of an IS; specifically, we • examine design techniques and strategies for printed • reports, screen output, and other systems outputs. Systems design overview • Logical Design • The logical design of an IS defines the logical or • conceptual relationships among the components of the IS. • A logical design defines all the input available to the • system, all the outputs that must be produced by the • system, and all the processes that must be performed to • meet the defined system requirements independent of how • they will be physically accomplished.
Physical design • The physical design of an IS is concerned with • the actual physical implementation of the logical • design. • Phase iterations • The phases in the SDLC are sometimes said to be • iterative. Man IS professionals say that you iterate • between analysis and design, repeating and refining, • until an effective physical design is developed. • A system analyst should never expect to return to a • previous phase.
Systems design activities • Review the system requirement • Design the system • Design the systems output • Design the systems input • Design the systems files and database • Design the systems processing • Design the software • Present the system design
General guidelines for systems design The goal of the systems design effort is to design an IS that will be effective, reliable, and maintainable. To be effective, the system must satisfy the defined requirements and meet the specified constraints. But a system that is not used cannot be effective. An effective system is one that the end users accept and actually use. The reliability of an IS relates to how the system reacts to errors, whether they are input data errors, processing errors, hardware failures, or human mistakes. A more realistic approach for system
reliability is for the system to plan for errors, detect them when they first occur, and allow for their correction. An IS has maintainability if it is simple, flexible, and easy to modify. Modifications will be necessary to correct errors in the system, to adapt the system to changing end user requirements, or to enhance the system to add capabilities or to take advantage of changing technology. Your systems design must be flexible enough to accommodate future modifications.
Design tips • The following tips will help you design effective, • reliable, and maintainable information systems. To • make them easier to use, we have classified these tips • by end user considerations, data considerations, and • processing considerations. • End user considerations • Consider point where end users interact with • the system • Anticipate future end user needs • Data considerations • Enter data where and when it occurs • Verify data when it is input
Use automated data entry methods whenever • possible • Control access for data entry • Report every instance of entry and change to data • Enter data only once • Avoid duplicating data in data stores • Processing considerations • Choose the simple solution • Create independent modules that perform a • single function
Output design introduction • The primary output media for an IS are printers • and screens, but several other media are used to output • information, output device, output technologies : • Printer • Display Screen : monitor, CRT, or VDT • Plotter • Computer output microfilm (COM) • Voice, Audio • Specialized device : point-of-sale terminals, • ATMs • Electronic output : Fax, Email, WWW
ตัวอย่าง Printed Output Pre-printed form Tabular Printed output
Designing printed reports • Reports are classified by their content and by • their distribution. The classification by content includes • detail, exception, and summary report, whereas the • classification by distribution includes internal and • external reports. • Reports classified by content • Detailed Reports • Exception Reports • Summary Reports • Analytical Reports • Historical Reports • Turnaround Report
September 5, 1998 Student and Course Report Page 1 of 348 Fall Semester 1998 Last, First Name Student ID Course ID Units Section 3 3 3 3 3 15 3 3 3 3 1 13 3 3 3 3 3 3 18 2 1 1 1 3 1 2 2 1 5 1 2 1 2 1 1 Adams, Mary Aherns, Madhi Banks, Jamal Bio101 Eng100 Soc105 Phl108 Eco104 Total Act102 Bio101 Chm109 Phl108 PEd118 Total Chm109 Eco104 Eng100 MIS111 Mkt114 Soc105 Total 387-33-8610 559-68-0348 371-49-3256 Detail Report
Exception Report: Only those employees who have worked overtime are include in the report
San Diego Weather Exception Report For Calendar Year 1997 Lower Limit: 45 degrees; Upper Limit: 85 degrees 1/9/98 Date Time of Day Temperature 04:15am 04:12am 04:11am 03:50am 03:40am 02:57am 02:45pm 02:38pm 02:30pm etc... 42 41 41 39 40 44 89 94 95 etc... 01/11/97 01/12/97 01/13/97 02/08/97 02/26/97 03/14/97 07/19/97 07/20/97 07/21/97 etc... Exception Analytical Report
Summary Report September 5, 1998 Course Summary Report Page 1 of 28 Fall Semester 1998 Total Total Avg. Course ID Course Name Units Sects Enroll Enroll/Sect 75 ... ... 100 ... ... 45 ... ... 30 .. .. 26 ... ... 110 ... ... 55 ... ... 12 300 ... ... 600 ... ... 90 ... ... 60 .. .. 208 ... ... 330 ... ... 110 ... ... 84 Act102 ... ... Bio101 ... ... Chm109 ... ... Eco104 ... ... Eng100 ... ... MIS111 ... ... Mkt114 ... ... PEd118 Accounting Prin. ... ... Intro to Biology ... ... Organic Chem. ... ... Macro Economics ... ... Begin. English ... ... Intro to Computers ... ... Prin. of Marketing ... ... Begin. Golf 4 .. .. 6 .. .. 2 .. .. 2 .. .. 8 .. .. 3 .. .. 2 .. .. 7 3 ... ... 3 ... ... 3 ... ... 3 ... ... 3 ... ... 3 ... ... 3 ... ... 1
Horizontal Analytical Report Data Based Decisions, Inc. Comparative Balance Sheet - Horizontal Analysis For Fiscal Years 1996 and 1997 - values in millions 1/27/98 1996 1997 Amount Percent Difference Difference Assets Cash Accounts Receivable Office Equipment Total Assets Liabilities Accounts Payable Long-Term Debt Total Liabilities Capital Common Stock Retained Earnings Total Capital Total Liabilities & Capital 0.8 3.7 5.5 10.0 1.2 2.8 4.0 3.0 3.0 6.0 10.0 $ 0.6 3.3 5.2 9.1 1.1 3.2 4.3 3.0 1.8 4.8 9.1 $ $ 0.2 0.4 0.3 0.9 0.1 (0.4) (0.3) 0.0 1.2 1.2 0.9 33.0 % 12.1 5.8 9.9 9.1 (12.5) 7.0 0.0 66.7 25.0 9.9
Vertical Analytical Report Data Based Decisions, Inc. Comparative Income Statement - Vertical Analysis For Fiscal Years 1996 and 1997 - values in millions 1/27/98 -----------1996-------- ----------1997----------- Amount Percent Amount Percent Income: Hardware Sales Software Sales Supplies Sales Consulting Services Total Income Expenses: Advertising Office Salaries Hardware Software Supplies Total Expenses Net Income before taxes Income Taxes Net Income $ 1.6 1.2 0.2 4.4 7.4 0.2 0.3 3.3 0.9 0.7 0.1 5.5 1.9 0.8 1.1 $ 1.9 1.7 0.3 5.2 9.1 0.3 0.4 3.9 1.1 1.2 0.2 7.1 2.0 0.9 1.1 20.9 18.7 3.3 57.1 100.0 3.3 4.4 42.9 12.1 13.2 2.2 78.1 21.9 9.9 12.0 21.6 16.2 2.7 59.5 100.0 2.7 4.1 44.6 12.2 9.5 1.4 74.5 25.5 10.8 14.7
Counterbalance Analytical Report Data Based Decisions, Inc. North Island Networking Project Analysis Project Start Date: 10/1/98 - ($000 omitted) 8/12/98 Worst Case Moderate Case Best Case Income: Hardware Sales Software Sales Supplies Sales Consulting Services Total Income Expenses: Project Overhead Salaries Hardware Software Supplies Total Expenses Net Income on the project 800 300 050 150 1,300 200 140 750 200 40 1,330 (30) $ $ 850 350 050 190 1,440 200 150 650 160 40 1,200 240 $ 800 300 050 175 1,325 200 140 700 180 40 1,260 65
Variance Analytical Report Student Personal Monthly Budget Variance Analysis Month: October 1997 11/9/97 Budget Actual Variance Income Expenses Rent Telephone Car Payment Insurance Food/Drink Clothes School Supplies Savings Utilities Gifts Discretionary Total Expenses Balance Remaining (2.9%) (20%) (7.4%) 24% 68% (12%) (40%) (10%) (0.4%) $ 700 150 20 100 70 135 50 25 50 25 25 50 700 0 (20) (4) (10) 12 17 (3) (10) (5) (3) (23) $ 680 150 24 100 70 145 38 8 50 28 35 55 703 (23) $
Reports classified by distribution • Internal reports • External reports • Turnaround report September 5, 1998 Course Summary Report Page 1 of 28 Fall Semester 1998 Total Total Avg. Course ID Course Name Units Sects Enroll Enroll/Sect 75 ... ... 100 ... ... 45 ... ... 30 .. .. 26 ... ... 110 300 ... ... 600 ... ... 90 ... ... 60 .. .. 208 ... ... 330 Act102 ... ... Bio101 ... ... Chm109 ... ... Eco104 ... ... Eng100 ... ... MIS111 Accounting Prin. ... ... Intro to Biology ... ... Organic Chem. ... ... Macro Economics ... ... Begin. English ... ... Intro to Computers 4 .. .. 6 .. .. 2 .. .. 2 .. .. 8 .. .. 3 3 ... ... 3 ... ... 3 ... ... 3 ... ... 3 ... ... 3 Internal Report Samples
September 5, 1998 Student and Course Report Page 1 of 348 Fall Semester 1998 Last, First Name Student ID Course ID Units Section 3 3 3 3 3 15 3 3 3 3 1 13 2 1 1 1 3 1 2 2 1 5 Adams, Mary Aherns, Madhi Bio101 Eng100 Soc105 Phl108 Eco104 Total Act102 Bio101 Chm109 Phl108 PEd118 Total 387-33-8610 559-68-0348 371-49-3256 Internal Report Samples
Order Number Order Date ABC Incorporated SALES ORDER FORM Customer Number Customer Name Street Address City State Zip Code Product Product Unit Total Number Name Color Price Quantity Price 1 2 3 4 5 6 7 ORDER TOTAL SALES TAX SHIPPING GRAND TOTAL Come to ABC Incorporated for all your technology needs. Thank you for your patronage. You are a valued customer. External Report Sample
Report design considerations • To design the actual physical format of a printed report, • You use a printer spacing chart. Printer spacing charts • provide a standardized method for visually • documenting a report format; programmers use them • when writing the program to produce the report. • Report volume calculations • During the systems analysis phase, you estimated the • size of every printed report. System analysts and • management use these volume calculations to decide if • additional printers must be purchased. • Report approvals • The end users must approve every report design.
The Employee Hours report is a detail report with control breaks.
Designing screen output • Screen output is very important to business • organizations. Today, most people in an organization • have ready access to a VDT or personal computer, you • find computer workstations everywhere from shop • floors and loading docks to executive offices. Screen • output offers several advantages over printed output. • Most importantly, screen output is timely. • Screen design considerations • Character output • Graphical output • Special video effects
Command button Quit Report
September 5, 1998 Student and Course Report Page 1 of 348 Fall Semester 1998 Last, First Name Student ID ourse ID Units Section a) z o n e d Adams, Mary Aherns, Madhi , Jamal 3 3 3 3 3 15 3 3 ... 2 1 1 1 3 1 2 ... Bio101 Eng100 Soc105 Phl108 Eco104 Total Act102 Bio101 ….. 387-33-8610 559-68-0348 b) g r a p h i c Output formats. Today's information systems present information in three basic formats--zoned, graphic, and narrative as illustrated in Figure 9.3. Format refers to the look of the output on the media, hence sound is not included here. Zoned output is the traditional row and column oriented textual and numeric information. Graphic output... c) narrative Output Format Examples
OUTPUT DESIGN OUTPUT GRAPHS • SCATTER DIAGRAM • LINE DIAGRAM • BAR CHART - horizontal & vertical • SECTOGRAPH - pie & layer
data sets: C D B A X Y X Y X Y X Y 9 14 12 15 6 11 16 10 7 14 17 19 12 18 14 20 13 15 11 16 8 6 13 7 11 5 12 10 14 9 8 9 8 8 8 9 3 6 7 9 8 10 9 13 14 11 4 6 7 12 6 13 11 15 2 10 17 8 5 14 5 7 13 10 3 6 11 14 17 12 10 8 17 13 4 5 9 11 19 15 Scatter Diagrams Y C 20 15 10 5 . . . . . . . . . . X 0 5 10 15 20 Y Y Y B D A 20 15 10 5 20 15 10 5 20 15 10 5 . . . . . . . . . . . . . . . . . . . . . . . . . . . . . . X X X 0 5 10 15 20 0 5 10 15 20 0 5 10 15 20
Line Diagram Computers Unlimited, Inc. Sales of Hardware and Software For Year 1997 in Dollars 200 175 150 125 100 75 50 25 0 Hardware Software Jan Feb Mar Apr May Jun Jul Aug Sep Oct Nov Dec
Vertical Bar Chart California State University, Pasadena College of Business Administration Total Enrollment by Semester 500 450 400 350 300 250 200 Fall Spring Fall Spring Fall Spring Fall Spring ‘94 ‘95 ‘95 ‘96 ‘96 ‘97 ‘97 ‘98
Pie Chart California State University, Pasadena College of Business Administration Enrollment by Major - Fall 1997 Marketing 16% Accounting 24% Management 20% Finance 22% Information Systems 18%
Layer Graph California State University, Pasadena College of Business Administration Total Enrollment by Semester 350 300 250 200 150 100 50 Marketing Management Information Systems Finance Accounting Spring Fall Spring Fall Spring ‘96 ‘96 ‘97 ‘97 ‘98
3 Dimensional (3D) Horizontal Bar Chart California State University, Pasadena College of Business Administration Enrollment by Major - Fall 1997