Download
1 / 42
430 likes | 639 Vues
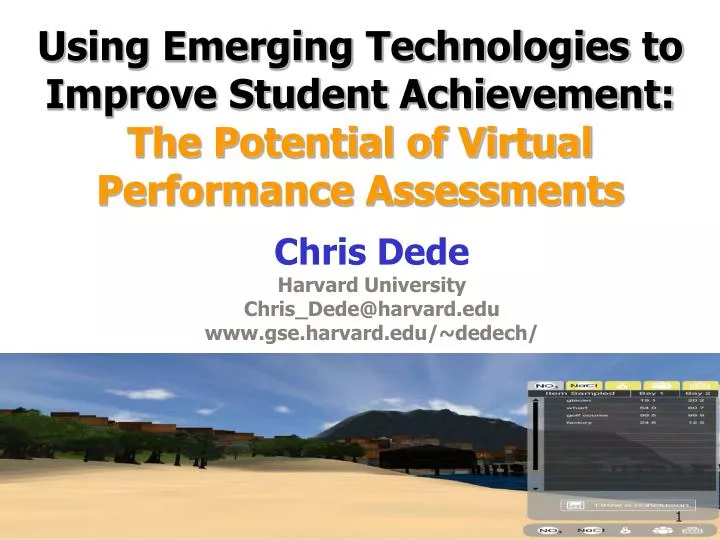
Using Emerging Technologies to Improve Student Achievement: The Potential of Virtual Performance Assessments. Chris Dede Harvard University Chris_Dede@harvard.edu www.gse.harvard.edu/~dedech/. Flawed Assessments Undercut Student (and Teacher) Achievement.

E N D
Using Emerging Technologies to Improve Student Achievement:The Potential of Virtual Performance Assessments Chris Dede Harvard University Chris_Dede@harvard.edu www.gse.harvard.edu/~dedech/
Flawed Assessments Undercut Student (and Teacher) Achievement “Drive-by” high stakes tests frighten many students into suboptimal performance,which cumulatively leads to disengagement,low self-efficacy, and alienation Students are rightly wary of investingin knowledge that tacitly is not valuedbecause it is not measured or rewarded. Teachers are forced to emphasizetest performance rather than domain mastery
Current Summative Tests Undercut Achievement and Motivation Paper-and-pencil item-based tests are inexpensive, reliable, and practical – but not valid for higher order thinking skills, such as scientific inquiry, or 21st century skills, such as mediated collaboration. Physical performance assessments are more valid for sophisticated skills, but unreliable, impractical, expensive, and limited in typesand number of tasks possible
The Assessment Triangle • Cognition • model of how students represent knowledge & develop competence in the domain • Observations • tasks or situations that allow one to observe students’ performance • Interpretation • methods for making sense of the data Cognition Observation Interpretation Reasoning from Evidence
Mediated Performancesare an Untapped Resource • Cognition is distributed across human minds, tools/media, groups of people, and space/ time; dispersed physically, socially, and symbolically • Event-logs of performances and communications provide insights • Distributed learning: collaborative, mediated, scaffolded, and data-generating
Types of Rich Datastreams • Multi-User Virtual Environments:Immersion in virtual contexts withdigital artifacts and avatar-based identities • Wikis and other forms of Web 2.0 media • Asynchronous Discussions • Intelligent Tutoring Systems • Games • Augmented Realities
What is a MUVE? • An “Alice in Wonderland” experience where users enter a virtual space that has been configured for learning • Learners represent themselves through graphical avatars to communicate with others’ avatars and computer-based agents, as well as to interact with digital artifacts and virtual contexts
River City Figure 1: Lab Equipment inside the University Figure 2: River Water Sampling http://muve.gse.harvard.edu/rivercityproject
Assessment data: Pre-post content Pre-post affective Embedded assessments (formative) Performance assessment (summative) Contextual Data: Attendance records Demographic data School data Observations Interviews Active Data: Team chat Notebook entries Tracking of in-world activities: Data gathering strategies Pathways Inquiry processes Evidence of Student Work
Event Logs as Observational Data Indicates with Timestamps • Where students went • With whom they communicatedand what they said • What artifacts they activated • What databases they viewed • What data they gatheredusing virtual scientific instruments • What screenshots and notations they placed in team-based virtual notebooks unobtrusiveobservational data
Student’s Role in theRiver City MUVE • Travel back in time 6 times between 1878-79 • Bring 21st century skills and technologyto address 19th century problems • Help town understand and solve part ofthe puzzle of why so many residentsare becoming ill • Work as a research team • Keep track of clues that hint at causes of illnesses • Form and test hypotheses in a controlled experiment • Make recommendations based on experimental data
Capturing Data onChange over Time Visit 1 Visit 2 Visit 3 Visit 4 Fall, 1878 Winter, 1879 Spring, 1879 Summer, 1879 Students visit the same places and see how things changeover time. They spend an entire class period in an individual season, gathering data.
“Evidence Gathering” • An important, generic inquiry process • amount(how much evidence per time spent) • range(coverage/balance among all the types of evidence) • saliency(importance of the evidence inunderstanding causality in the situation) • clustering(grouping of evidence based on its causal affiliation)
“Evidence Gathering” • Foundational for other inquiry processes • hypothesis formation, experimental design,and argumentation • Related to student attributes • self-efficacy, metacognition, engagement,and content knowledge
Virtual Performance Assessments Funded by Institute of Educational Sciences Three year grant Design three virtual performance assessments to assess middle grade(6th and 7th) students' science inquiry learning in a standardized testing setting http://virtualassessment.org
NSES Model of Inquiry Identify questions that can be answered through scientific investigation (not independent of knowledge) Design and conduct a scientific investigation Use appropriate tools and techniques to gather, analyze, and interpret data Develop prescriptions, explanations, predictions, and models using evidence Think critically and logically to make the relationships between evidence and explanations Recognize and analyze alternative explanations and predictions Communicate scientific procedures and explanations Use mathematics in all aspects of scientific inquiry
Authentic Environments A Challenge on which Every Student has Roughly Equal Familiarity
Assessment Platform 3-D Immersive Environment for Science ExperimentationBased on Authentic Setting Highly Secure, Cross Platform Application Builtin the Unity Framework Realistic Complex Causal Model For Science Experimentation
Back End Architecture Real-Time Analysis of Student Paths All Interactions are Logged for Future Research Ensure Data Integrity by Encrypting Data Along the Way Complex Student Work Product is Recorded as XML, which can be tokenized
EcoMUVE(www.ecomuve.org)Formative/Diagnostic • Formative, diagnostic assessment provides more leverage for improvement than summative measures • Formative, diagnostic assessment is richerand more accurate than summative measures • Potentially, formative, diagnostic assessment could substitute for summative measures.
Module 1: Pond Ecosystem Modeled after Black’s Nook Pond in Cambridge, MA
Instruction and Assessment based on Learning Trajectories Table 1: Forces as Interactions facet cluster (Krauss & Minstrell, 2002) • 00 All forces are the result of interactions between two objects. Each object in the pair interacts with the other object in the pair. Each influences the other. • 01 All interactions involve equal magnitude and oppositely directed action and reaction forces that are on the two separate interacting bodies. • 40 Equal force pairs are identified as action and reaction but are on the same object. For the example of a book at rest on a table, the gravitational force on the book and the force by the table on the book are identified as an action-reaction pair. • 50 Effects (such as damage or resulting motion) dictate relative magnitudes of forces during interaction. • 51 At rest, therefore interaction forces balance. • 52 "Moves", therefore interacting forces unbalanced. • 53 Objects accelerate, therefore interacting forces unbalanced. • 60 Force pairs are not identified as having equal magnitude because the objects are somehow different. • 61 The “stronger” object exerts a greater force. • 62 The moving object or the one moving faster exerts a greater force. • 63 More active/energetic exerts more force. • 64 Bigger/heavier exerts more force. • 90 Inanimate objects cannot exert a force.
Types of Rich Datastreams • Multi-User Virtual Environments:Immersion in virtual contexts withdigital artifacts and avatar-based identities • Wikis and other forms of Web 2.0 media • Asynchronous Discussions • Intelligent Tutoring Systems • Games • Augmented Realities
Related Initiatives • Cisco-Intel-Microsoft global initiative on assessing 21st century skills • Advances in European measures, such as PISA • Evolution of US tests, such as NAEP • Numerous other scholars working on games and simulations for learning and assessment A Breakthrough in the Next Few Years-But Don’t Wait!
“Disruptive” Assessment Rewarding Achievement Useful in Real World • Students see academic learning as relevant • Quality is measured in sophisticated ways along multiple dimensions • Rote teaching and learning are exposedas tragically inadequate • Learning and formative assessment arerichly interwoven in engaging ways
Call for New Measuresof Inquiry Paper-and-pencil tests, such as the National Assessment of Educational Progress (NAEP), Third International Math and Science Study (TIMSS), and New Standards Science Reference Exams (NSSRE), don’t measuring inquiry well and aren’t aligned with the NSES standards NAEP published their framework for establishing a new science assessment in 2009 that calls for multiple modes of assessment, including interactive computer assessments
“Immersive” Interfaces for Learning • Virtual RealityFull sensory immersion via head-mounted displays or CAVES • Multi-User Virtual EnvironmentsImmersion in virtual contexts withdigital artifacts and avatar-based identities • Ubiquitous ComputingWearable wireless devices coupled tosmart objects for “augmented reality”
Affordances ofImmersive Interfaces The types of behaviorsimmersive interfaces can enable Complex situations with tacit clues Simulated scientific instruments Virtual experimentation Simulated collaboration in a team Adaptive responses to student choices Documented in Event-logs and Chat-logs
Traditional Evaluation of Quality Inferential methods: On average, students in the River City treatment scored .2 points higher on the post self-efficacy in general science inquiry section of the affective measure (t=2.22, p<.05). On average, students in this sample who saw higher gains in self efficacy in general science inquiry scored higher on the post test. These gains were higher for students in the River City project(n=358). Yet these results tell us nothing about patterns, behaviors,and processes that lead to inquiry. We are also limitedby # of variables we can build into our inferential models.
Goals of IES VPA Project Proof of Concept for Immersive Virtual Performance Assessments (IVPAs) thatMeasure Sophisticated Intellectual/Social Skills Establish higher validity than physical performance assessments (PPAs) No challenges of physical materials Virtual worlds enable performances impossible in classrooms Establish higher reliability and usability than PPAs,as well as lower cost Detailed tracking of participant behaviors Respectable psychometrics compared topaper-and-pencil item-based tests Establish that student engagement leadsto every participant working hard to succeed The importance of shifts in identity
Research Questions Can we construct a virtual assessment that measures scientific inquiry, as defined by the National Science Education Standards (NSES)? What is the evidence that our assessments are designedto test NSES inquiry abilities? Are these assessments reliable?
Research Methods Alignment studies Cognitive analysis studies(think-alouds with students) Generalizability study acrossthree instances of the same assessment
Assessment Framework Evidence Centered Design I.Domain Analysis II. Domain Modeling III. Conceptual Assessment Framework IV. Assessment Implementation V. Assessment Delivery VI. Refinement
Domain Analysis We analyzed different models forscience inquiry: NSES Standards (National Research Council, 1996) Inquiry Cycle (White & Frederiksen, 1998) Novice-expert models(Chi, Feltovich, & Glaser, 1981) Scientific Discovery as Dual Search (SDDS)(Klahr, 2000) Epistemological & Strategic (Kuhn & Pease, 2008) NAEP Framework (NAEP, 2008)
Inquiry Models “The whole of science is nothing more than a refinement of everyday thinking.” -- Einstein, 1936 (quoted in Klahr, 2000) Inquiry is the way we think. Some people do it better. Experts are doing something cognitively different in their head.
Enhanced Assessment Platform Use Performance Palettes to Collect Student Work Minimize the Prediction of Language Art Skillsvia use of Audio Instruction and Visual Cues Enable Realistic Use of Tools Anywhere in the World
Map of the Context Can vary the casual model, so the assessment can differ from one studentor class to another – as long as each model has an equivalent amount of evidence collectable with equivalent time and effort