Download
1 / 110
1.18k likes | 1.43k Vues
Surface and Thin Film Physics Adolf Winkler Institute of Solid State Physics, TU Graz. Literature: K. Oura et al., Surface Science, Springer Verlag, 2003 (ISBN 3-540-00545-5; TU Bibliothek I 190.293) Contents: Experimental Background – UHV Technology

E N D
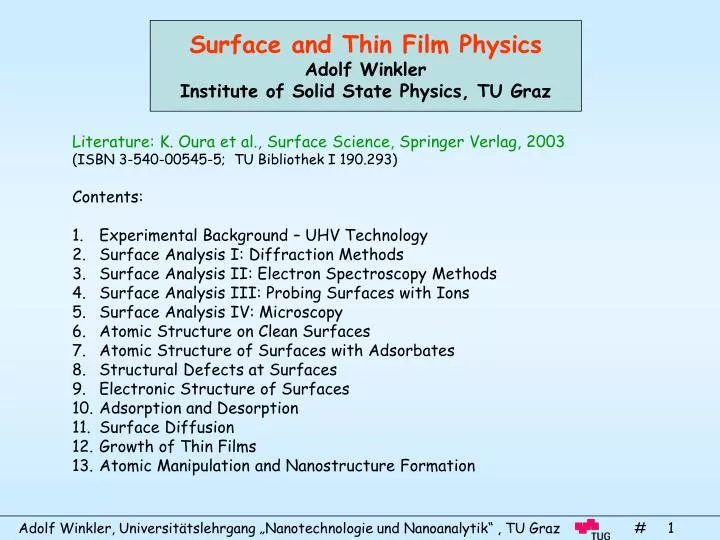
Surface and Thin Film Physics Adolf Winkler Institute of Solid State Physics, TU Graz • Literature: K. Oura et al., Surface Science, Springer Verlag, 2003 • (ISBN 3-540-00545-5; TU Bibliothek I 190.293) • Contents: • Experimental Background – UHV Technology • Surface Analysis I: Diffraction Methods • Surface Analysis II: Electron Spectroscopy Methods • Surface Analysis III: Probing Surfaces with Ions • Surface Analysis IV: Microscopy • Atomic Structure on Clean Surfaces • Atomic Structure of Surfaces with Adsorbates • Structural Defects at Surfaces • Electronic Structure of Surfaces • Adsorption and Desorption • Surface Diffusion • Growth of Thin Films • Atomic Manipulation and Nanostructure Formation
1. Experimental background – UHV Technology Experimental surface science only possible in UHV. Reason: The surface composition should remain unchanged (clean) during the experiment. From kinetic gas theory it follows: Impingement rate: Mean free path: Molecular density: Monolayer formation time: Some important numbers:
Some vacuum considerations: Consider a simple model of a vacuum chamber which is evacuated by a pump via a tube Throughput: Pumping speed: Conductance: The effective pumping speed is: The pumping equation: The base pressure: The gas load QT contains: a) real leaks, b) virtual leaks (e.g. diffusion), c) degassing (i.e. desorption) Air exposed surfaces contain thin films of water, nitrogen, oxygen etc. Bakeout of vacuum chamber helps to increase outgassing and hence to reach a good vacuum in shorter time (typically 150-200 °C for 24 h)
Ultra-High-Vacuum (UHV) Technology Material: Take only low outgassing and temperature stable materials! Stainless steel (304), copper, aluminum, refractory metals (Ta, W, Mo) μ-metal, glass, ceramics, teflon, viton, capton Do not take: plastics, rubber, zinc plated steel, brass, glue, Pumping systems: Rotary pumps Cryosorption pumps Ion pumps Turbomolecular pumps Pressure gauges: Ion gauge (Bayard-Alpert) Thermocouple and Pirani
Typical UHV pumping system and UHV hardware Residual gas composition • just after pump down of tight chamber (10-6 Torr) • System with air leak (10-6 Torr) • Properly baked system (10-9 Torr)
Preparation of atomically clean surfaces Ex-situ: polishing, chemical etching, boiling in solvents, rinsing in de-ionized water In-situ: • Cleavage: Only for brittle material, mainly for oxides (ZnO), halides (NaCl) semiconductors (Si, GaAs); surface is clean, but often contains steps • Heating: By electrical current, electron bombardment or laser annealing. Mostly for metal samples, not all contaminants can be removed, segregation may occur • Chemical treatment: Heating in reactive gas, e.g. W in oxygen at 10-6 Torr and 2000 °C removes C by CO formation and desorption • Ion sputtering and annealing: Bombarding the surface by Ar ions (~ 1 kV), highly effective, but problems are degradation of structure; therefore subsequent annealing. Also preferential sputtering possible In conclusion, cleaning may by very difficult, combination of techniques necessary.
UHV deposition technology In some cases one wants to deposit material on surfaces, e.g by evaporation Impingement flux: To achieve typical deposition rates of 1 ML/min one needs a vapour pressure of about 10-4 Torr Evaporation sources: Thermal source (W, Ta, Mo boats) Knudsen cells Electron beam evaporators SAES getters (for alkalis) Deposition monitors: Quartz crystal thickness monitor (Eigenfrequency of quartz depends on mass (typ. 5-10 MHz)
2. Surface Analysis I: Diffraction methods In surface science very often well ordered single crystal surfaces are investigated. This can be done by scattering of electrons (which have wave character) on the regular array on the surface. Electrons penetrate only a few monolayers into the sample, therefore they are surface sensitive (for comparison X-rays are more bulk sensitive) Low Energy Electron Diffraction (LEED) Experimental setup: Consists of electron gun, sample and hemispherical grids+ fluorescence screen. Electron energy typ. 50 – 300 V Sample and 1st grid on earth potential Retarding potential on 2nd grid, V-ΔV. Therefore only elastically scattered electrons reach the last grid and are accelerated (5 kV) to the screen. The observed diffraction pattern is the reciprocal lattice of the geometric surface lattice. The de Broglie wavelength of electrons is given by:
Reciprocal lattice and diffraction pattern • The concept of reciprocal lattice (r.l.) is useful when dealing with diffraction for • structural investigations • 2D r.l. is a set of points defined by: • Definition of reciprocal lattice vectors: • (a, b: real space unit vectors) • From this it follows: • The vectors a* and b* are in the same surface plane as the real space vectors a, b. • a* is perpendicular to b and vice versa • The length of the rec. vectors are: and v.v a: oblique lattice b: rectangular c: hexagonal d: centered rectangular
Diffraction or elastic scattering For elastic scattering the laws of conservation of energy and momentum have to be fulfilled. This is true if the momentum changes by a reciprocal lattice vector: This holds for 3D (X-ray scattering, Ghkl ) and 2D (electron scattering, Ghk) For the 2D case the wave vector component normal to the surface is not conserved Due to the above equations one can construct the diffraction patterns, Ewald construction 2D: 3D: Labeling of LEED spots In the 2D case the reciprocal lattice points are actually reciprocal lattice rods normal to the surface. Only the wave vector components parallel to the surface change by reciprocal lattice vectors
Interpretation of LEED patterns a) Sharpness of LEED patterns: Well ordered surfaces exhibit sharp bright spots and low background intensity. The presence of surface defects and crystallographic imperfection results in broadening and weakening of the spots and increased background b) LEED spot geometry: This yields information on the surface geometry, i.e. symmetry and lattice constants. Furthermore one can deduce information on possible reconstructions or superstructures caused by adsorbates To produce diffraction patterns the surface area has to be at least the length of the coherence length (typically several 100 Å). Therefore sometimes superposition of several domains leads to new diffraction patterns eg. 2x2 superstructure on hexagonal lattice leads to the same pattern as three domains of (2x1) superstructures
c) LEED spot profile: The spot profile is determined by the perfectness of the surface. Any imperfections broaden the spot. Reducing the domain size broadens the spot too. Even for a perfect crystal surface there is some finite spot widths due to the finite coherence length, determined by the energy distribution and the angular spread of the electron beam. Regularly stepped surfaces lead to split spots. In this case the diffraction conditions are given by two regularities, the terraces and the atomic arrangement in the terraces. d) LEED I-V analysis: The spot geometry gives only information on the regular arrangement on a surface. No information can be obtained for the local arrangement of the surface atoms (adsorbates) to the underlying array. However, due to multiple scattering the local arrangement of the scatterer within the surface unit cell influences the scattering. This shows up in special modulations of the spot intensities as function of the electron beam: Therefore I-V curves have to be measured. On the other hand, I-V curves can be calculated by assuming a special atomic arrangement. Usually, by a trial and error method the best fit between experimental and theoretical I-V curves yields then the most probable atomic positions within the unit cell. A quantitative criterion for the fit is the R-factor or the Pendry-R factor. In many cases the results are not unambiguous.
Reflection High-Energy Electron Diffraction (RHEED) The disadvantage of LEED is that close to normal incidence of the beam is necessary. Therefore, one can not control the surface geometry, e.d. during film growth (epitaxy). For this purpose RHEED is used. The set up: High energetic electrons (5-100 keV) impinge under grazing angles (1-5°) on the surface. The fluorescence screen is just a coated viewport of the UHV chamber. No acceleration necessary, no background filtering necessary. The Ewald construction in RHEED: In this case the radius of the Ewald sphere is much larger than the spacing of the reciprocal rods. Due to the gracing incidence and the finite thickness of the rods and the sphere the diffraction spots are noticeably streaked.
RHEED is usually used to monitor the surface structure during epitaxial layer growth. RHEED analysis: The spots in the pattern correspond to the grazing intersection of reciprocal rods with the large Ewald sphere. RHEED also allows to check the growth of 3D islands
Gracing incidence X-Ray Diffraction (GIXRD) Typically, XRD is a bulk sensitive technique due to the small cross section (10-6 Å2 compared to 1 Å2 for LEED), but grazing incidence (<1°) makes it surface sensitive (total reflection, because the refractive index of X-rays is slightly smaller than unity). The refracted wave becomes an evanescent wave traveling along the surface within a few 10 Å. GIXRD experimental setup: High intense and strongly collimated X-rays are produced in a synchrotron. Light enters the UHV chamber via Be windows. High precision sample positioning required (0.001°). Ewald construction: Grazing incidence, but low wavelength of X-ray (~1.5 Å, ~8 kV) Typically at constant incidence angle the sample is rotated azimuthally. Only for special conditions scattering in grazing angle appears. Whereas the experimental procedure is quite complicated, the data analysis is relatively simple due to the single-scattering approximation.
Surface Analysis II: Electron Spectroscopy Methods General remarks: If surfaces are bombarded by electrons, secondary electrons are emitted. These electrons carry information on the electronic structure of the surface atom, i.e. chemical surface composition can be investigated. Surface sensitivity due to strong scattering, i.e. low mean free path • A typical secondary electron spectrum shows • several features: • Sharp elastic peak at primary energy Ep • Broad featureless peak at 0-100 eV with long • tail (true secondaries) • Small peaks in the middle range (Auger electrons) • Small peaks close to the elastic peak (Phonon and • plasmon losses)
Electron energy analyzers Several analyzers can be used to measure the kinetic energy of the secondary electrons. • Retarding field analyzer (RFA): • Only electrons with energy E larger than a retard potential are collected by a • detector. The retard potential is scanned. (LEED arrangement). (High pass filter) • Cylindrical mirror analyzer (CMA) • Band pass filter, only electrons with a particular energy find their way through the two slits to the detector, due to a deflection potential • Concentric hemispherical analyzer (CHA) • Two concentric hemispheres, double focusing after 180°. • 127° Cylindrical sector analyzer (CSA) • Two concentric cylinder sectors, single focusing after 127°. RFA CMA CHA CSA
Auger Electron Spectroscopy Is the most commonly used method to investigate surface composition. The principle is as follows: An impinging electron (2-10 keV) creates a core hole and both electrons leave the surface. The ionized atom relaxes by emitting either an X-ray photon (X-ray fluorescence) or by ejecting another electron (Auger electron). For lighter elements Auger emission is favored over X-ray fluorescence. Three electrons are involved in the Auger process, therefore H and He do not produce Auger electrons. The energy of the Auger electrons depends on the energy levels of the atom: However, this is a rough estimate, because the final state is an ion and the levels may shift compared to the neutral atom. Φ: Work function (energy needed to bring an electron from the Fermi level to the vacuum level)
AES experimental set-up Standard equipment consists of: Electron gun Energy analyzer Detector Data processing unit CMA RFA Typically, the relatively small Auger signals N(E) are superimposed on a large background. Therefore the spectra are usually taken in the derivative mode, by applying a modulation voltage on the analyzer and detecting with a lock-in amplifier. Taking the amplitude of the first derivative () of a CMA signal, as well as the second derivative (2) of an RFA signal, yields dN/dE,
AES analysis Each atom has different electron energy levels and therefore yields different Auger electron energies. This is used to get elemental characterization. Although chemical shifts lead to changes in the Auger energies, AES is usually not used to get chemical information, due to the three electrons involved. Auger spectra for all elements are compiled in an Auger atlas Quantitative analysis is in principle possible but many unknown quantities involved: IP: Intensity of primary beam : Ionization cross section : Auger transition probability r: Backscattering factor T: Transmission probability of analyzer : Attenuation length z: Escape depth ,: Azimuth and polar angle
Electron Energy Loss Spectroscopy • Inelastic scattering events might lead to well-defined energy losses, covering a wide energy range from 104 to 10-3 eV: • Core level excitation: 100 – 104 eV (CLEELS) • Plasmon and interband excitation: 1 – 100 eV (EELS) • Phonon and adsorbate vibration excitation: 10-3 – 1 eV (HREELS) • Core Level Electron Energy Loss Spectroscopy (CLEELS) • The energy of the inelastically scattered electron is: The loss peaks are typically much smaller than Auger peaks, therefore one measures the second derivative. The loss energy defines the energy levels and CLEELS can therefore be used for elemental identification. As the fine structure of the spectra depends on the density of states (DOS) of the final (empty) states it can be used to identify the unoccupied DOS.
b) Electron Energy Loss Spectroscopy (EELS) This term is used generally for all ELLS but in particular for EELS in the range of a few ten eV, i.e. for interband and plasmon excitations. A plasmon is a collective oscillation of electron density in the bulk and its energy is quantized: In many cases there exists also a surface plasmon, localized at the surface, its energy is: EELS spectra are recorded either as N(E) or d2N(E)/dE2 EELS of Al, showing multiple losses of bulk and surface plasmons EELS of SiO2 layer on Si. Use of different primary energies (penetration depth) allows depth profiling
c) High-Resolution Electron Energy Loss Spectroscopy (HREELS) Losses due to phonon excitation and adsorbate vibrations are very small (meV), therefore the experimental identification is difficult. Monochromatization of the primary beam (typ. 10 eV with ΔE~5meV) is necessary. Cylindrical sector analyzers are used as monochromator and analyser (Ibach type). Most frequently HREELS is used to measure adsorbate vibrations. Identification of the adsorbate species, the adsorption site and the spatial orientation of the adsorbate is possible. In specular geometry only vibrations normal to the surface can be detected, in off-specular direction also parallel vibrations.
Photoelectron Spectroscopy (PES) If an atom absorbs a photon, a photoelectron will be emitted. The kinetic energy is: Depending on the energy (wavelength) of the photon used we distinguish between: XPS (X-ray photoelectron spectroscopy) or ESCA (el. spectr. chem. anal.) (E = 100 eV – 10 keV, wavelength 100 to 1 Å) UPS (ultraviolet photoelectron spectroscopy) (E = 10 – 50 eV, 1000 to 250 Å) N(Ekin) reflects the density of states below the Fermi level (valence band and high lying core levels). At low kinetic energy emission of inelastically scattered electrons (secondaries) is superimposed.
PES Experimental set-up a) For XPS X-ray tubes with Mg or Al anti-cathodes are used (E = 1253.6 eV and 1486.6 eV, respectively, line-widths: 0.8 eV), sometimes monochromators are used to decrease the linewidth (0.2 eV) and suppress satellites. b) For UPS He gas discharge lamps are used. Two intense lines can be generated (21.2 eV (He I) and 40.8 eV (He II)), depending on the discharge conditions. The line-width is very small (3 meV for He I and 0.17 meV for He II). c) A modern alternative is the use of synchrotron radiation. Accelerated electrons in a ring produce a continuous radiation from a few eV to several keV. With a monochromator one can select any required energy and tune it. The light is of high intensity and stability, 100% linear polarized and strongly collimated.
X-Ray Photoelectron Spectroscopy (XPS) In XPS core levels are excited, the spectrum reflects the energy levels of the atom. Therefore elemental characterization is possible. In addition to the photoelectrons there is a number of additional features in the spectrum, like continuous background, Auger peaks, plasmon losses. Furthermore, the cross section for excitation may be different for individual levels. Valence band electrons are only weakly excited. Qualitative evaluation of XPS spectra involves the comparison of spectra in the XPS-atlas. Quantitative evaluation can be done similarly to that described for AES. In general this method is more accurate for XPS, because less electrons are involved. Ni
High resolution XPS can yield a number of additional information: In particular the fine structure of the core levels, i.e. spin-orbit coupling can easily be seen. This splitting increases with binding energy. Furthermore, slight changes in the binding energies due to different chemical environment can be measured (typically 1 – 10 eV): Chemical shift. Different oxidation states will have different chemical shifts. The ability to investigate chemical composition is the reason for the name: ESCA The atomic environment on the surface normally differs from that in the bulk. Therefore, bulk and surface features are observed simultaneously. The surface sensitivity can be enhanced by grazing incidence light, and/or increasing the detection angle.
Ultraviolet Photoelectron Spectroscopy (UPS) This method mainly generates photoelectrons from the valence band and weakly bonded core levels (DOS below the Fermi level). There are two types of UPS, angle integrated and angle resolved UPS, In the angle integrated UPS typically the retarding field analyzer is used and yields the DOS. In the angle resolved mode (ARUPS) one takes a hemispherical or cylinder sector analyzer. With this technique one can determine the band structure E(k) of the electrons in the bulk and the surface near region. The measured kinetic energy can be written as: kex is the wave vector of the emitted photoelectron in the vacuum. When the electron passes though the solid-vacuum interface, only the parallel component of the wave vector is preserved. Therefore the parallel k-vector in the solid can be determined by the detection angle and the measured electron energy.
In the experiment the dispersion curve (band structure) is restored by measuring the photoemission spectra at different polar angles but with fixed azimuth. surface state surface projected bulk states Unfortunately, UPS is not only surface but also to some extent bulk sensitive. Therefore, contributions of bulk and surface electronic states are observed. There are several features which can be used to differentiate between these. For surface states there is only one dispersion curve, independent of the photon energy. Surface states reside in the band gap of the bulk states. Surface states are very sensitive to surface treatments and adsorption.
Surface Analysis III: Probing Surfaces with Ions • The most widely used techniques are the following: • Ions Scattering Spectroscopy (ISS) • (ions elastically scattered from the surface are energy analyzed) • Low-energy ion scattering spectroscopy (LEIS), (1-20 keV) • Medium-energy ion scattering spectroscopy (MEIS), (20 – 200 keV) • High energy ion scattering (HEIS) or Rutherford backscattering (RBS) • ( 200 keV – 2 MeV) • Elastic Recoil Detection Analysis (ERDA) • (target atoms or ions elastically recoiled by primary ions are energy analyzed) • Secondary Ion Mass Spectroscopy (SIMS) • (ions sputtered from a surface by a primary beam are mass analyzed) • The major application concerns elemental composition and atomic structure of surfaces. • Structural analysis is based on real space considerations. • Mainly short range arrangements of neighboring surface atoms can be investigated
General Principles • Classical binary collisions • In a first approximation, ion scattering can be described by elastic binary hard-sphere collisions Due to the law of conservation of energy and momentum one obtains the following relations for the scattered atom (E1) and the recoiled atom (E2): In the case of 90° or 180° scattering detection the equation for E1 simplifies to: 90°: 180°:
The hard sphere model describes the energetics, but ignores the particle interaction and does not describe the true trajectories and scattering probabilities. In fact Coulomb or Coulomb like repulsion between the nuclei describes the physics. The probability that an ion is scattered over a certain angle is given by the differential cross section (Rutherford formula): for m1 « m2 This shows: The cross-section is proportional to Z2 Forward scattering is much more probable than backward scattering However, energy separation is higher at higher angles So one has the choice between resolution and sensitivity.
Shadowing and blocking When a parallel ion beam impinges on a target atom, the trajectories are bent due to the repulsive forces, leading to so called shadow cones. These cones depend on the primary energy and the electronic charge of the involved particles There is a critical angle c above which the scattered projectile can hit a second atom. An additional phenomenon of shadowing is the blocking. A blocking cone is formed behind blocking atoms. This blocking can be nicely seen in the experiment, e.g. backscattering of 150 keV protons from a W(100) crystal
Channeling When an ion beam is aligned along a high symmetry of a single crystal, most of the ions can penetrate deep into the crystal (thousands of Å). This is due to the fact that the shadow cones are small for high energetic and light ions (e.g. 1MeV He+). During their way through the crystal electronic interaction leads to a continuous energy loss: electronic stopping power. For 1 MeV He+ in Si it is about 60 eV per monolayer. Sputtering Impinging ions may produce a number of recoiling atoms and in form of a cascade process some sample atoms may be ejected from the surfaces: sputtering
Sputter yield The number of sputtered atoms per impinging ions depends on the primary energy, the mass of the ions and the target atoms and the angle of incidence. The maximum yield is at about 30 keV. At higher energies ion implantation is prevalent. The sputter yield also increases with increasing angle • The application of sputtering is manifold: • Detection and identification of ions in the SIMS technique • Combined sputtering and surface analysis by AES or XPS for depth profiling • Sputtering for thin film production • Sputtering for surface etching
Ion induced electronic processes Ions impinging on a surface may be neutralized, may ionize target atoms or may induce electron emission. This can be due to kinetic emission or potential emission. Kinetic emission: Part of the kinetic ion energy can be transferred to kinetic energy of electrons. This takes place only for high energy (MeV) ions with high probability Potential emission: This takes place by neutralization of low energy ions (10-100 eV). Several processes may take place: Resonance neutralization (RN) Resonance ionization (RI) Quasi-resonant neutralization (QRN) Auger neutralization (AN) Auger de-excitation (AD) These processes are used in a technique called Ion Neutralization Spectroscopy (INS)
Low-Energy Ion Scattering Spectroscopy (LEIS or ISS) Extreme surface sensitive, due to large cross section and shadow cone radius (~Å). Major application is surface composition and structure. The energy loss spectra in LEIS give directly the composition. Quantitative evaluation is complicated due to: Ion neutralization Unknown scattering potential Multiple scattering He+ Less neutralization takes place for alkali ions, because Ei < 2Φ. (Alkali ISS) Another method is to measure both ions and neutrals, with TOF spectrometer. With this method one can switch between ion and total yield measurement Quantitative structural analysis is best done in the impact-collision geometry (ICISS), (180° geometry). Angle dependence of ion yield gives structural information.
Rutherford Backscattering (RBS) or High-energy ion scattering (HEIS) • The basic feature of this method are: • Small cross section and small shadow cones (<10-2 Å2) • Low neutralization probability • Negligible multi-scattering effects • Simple Coulomb interaction takes place • RBS is bulk sensitive, but also surface sensitive • for highly aligned configurations. In case of an ideal • lattice an aligned beam sees only the surface atoms, • but thermal vibration increases the backscattered • flux. Qualitatively the following information can be gained from RBS: The surface peak represents the surface atom density Lateral relaxation of the first layer changes the surface peak height. At non normal incidence relaxation normal to the surface can be investigated. Adsorbates show up as new peaks in the RBS spectrum.
Quantitative determination of surface structure can be obtained from angular dependence of surface and bulk peaks. Scattering from the second layer is blocked under special angles determined by the atom positions. If surface relaxation occurs this angle differs for the surface and bulk peaks, Thin Film Analysis Ions scattered in deeper layers have lost energy in two forms: Continuous energy loss (electronic stopping power) during inward and exit path. Discrete loss at the scattering event (nuclear stopping power) as a function of the mass ratios. Hence the scattering spectrum for ions from different thin films with different masses has special features.
Elastic Recoil Detection Analysis (ERDA) In this case recoiled target particles are energy analyzed. The same physics and technology as for ISS is used. Sometimes both techniques together are termed Scattering and Recoil Spectroscopy (SARS). The advantage of this technique is that light particles, in particular H can be detected. Again surface composition and structure can be investigated. As an example the adsorption geometry of hydrogen on Si(100) can be measured. Two energy loss peaks in the spectrum, which show different angular dependence, are caused by a direct recoil and a surface recoil process. This allows to determine the bond angles.
Secondary Ion Mass Spectroscopy (SIMS) Incident ions sputter particles from the surface, which are then mass analyzed. The sputtered particles can be neutral, positively or negatively charged, or clusters. The ratio of these individual particles strongly depends on the surface (matrix effect). SIMS is in principle quantitative but many parameters are not under control. Ip: Primary ion current Ci: Volume concentration of species I Si,j: Sputter yield i,j: ion yield T: transmission of mass spectrometer The ion yield depends on species, primary ion and matrix. Positive ion yield is favored for species with low ionization potential (e.g. K, Rb, Cs) and for negative ion yield vice versa (e.g. F, Cl, O). The ion yield can also be influenced by the primary ions: electropositive particles (Cs) lead to enhanced negative ion yield of the surface species and electronegative particles influence it vice versa. This is due to a change of the work function by adsorption of these particles.
There are two modes of SIMS: • Static SIMS • In this case the primary ion current is very low (10-10 A/cm2). The sputter rate is only a fraction of a monolayer per hour. This is a typical surface analytical method. Destruction of the surface is minor • Dynamic SIMS • In this case the primary ion current is high (10-5 A/cm2). The sputter rate is several monolayers per second. Therefore depth profiling can be performed. • However, the depth resolution may be affected by atomic mixing, selective sputtering, micro-roughening and uniformity of the primary beam. Typical depth profile of a Sb modulation doped silicon multilayer grown by molecular beam epitaxy.
Surface Analysis IV: Microscopy Field Electron Microscopy (FEM) A sharp metallic tip opposes a conducting fluorescent screen. A high voltage between these two electrodes (1-10 keV, tip radius ~100 nm) leads to strong electric fields (1 V/Å) at the tip and hence to electron emission. The electron current depends on the local work function. The magnification is just given by the ratio between tip radius and tip-screen distance. magnifications of 106 are possible. Resolution is about 20 Å. Close packed surfaces have higher work function than stepped surfaces FEM is limited to materials which can be fabricated as sharp tips, cleaned in UHV, and withstand high electric fields. It is restricted to W, Mo, Pt, Ir. Changes of the work function by adsorption can be studied. W(110)
Field Ion Microscopy (FIM) Apparatus is similar to FEM. In this case the tip is positively charged and a working gas (He, Ne) is admitted to the chamber. The tip is usually cooled to 70 K. The principle is the following: Gas atoms in the vicinity of the tip are polarized and attracted by the surface. There they are ionized and accelerated to the screen. Therefore each ion represents one surface atom. The resolution is about 1Å, i.e. atomic resolution is possible. This method is again used mainly for refractory metals. In addition to field ionization also field evaporation can take place: At higher voltages the surface atoms itself can be desorbed in the high local field (2-5 V/Å). With FIM one can study adsorption/desorption, surface diffusion of adatoms and clusters, adatom-adatom interaction, step motion, equilibrium crystal shape etc. W(110) 21 K He-H2
Transmission Electron Microscopy (TEM) The principle is the same as for optical microscopy, but using electron lenses. Due to the small de Broglie wavelength of high energetic electrons (100 keV Δ≈2Å) the resolution is much higher. Due to the limited penetration depth the samples should be very thin: about 100 - 1000Å. In classical TEM metals were deposited on alkali halides, covered by a thin film of carbon and then the alkali halide substrate was removed by dissolving in water. In this way nucleation, growth and coalescence of metal islands can be studied. Furthermore, the surface structure of alkali halides can be studied by this step decoration method. Another method to obtain thin samples is by mechanical cutting, electrochemical etching and ion milling. Cross section of hetero-structures with atomic resolution can be studied. NaCl cleavage surface decorated with Au Si/TbSi2/Si double heterostructure
Low-Energy Electron Microscopy (LEEM) In this technique low energy electrons (100 eV) which were reflected or refracted are used to form an image of the surface. The resolution is several 10 Å The primary beam leaves the e-gun with high energy (10 keV), it passes several lenses and a deflection prism and is decelerated in front of the surface. The reflected beam is again accelerated and deflected onto a screen. By choosing the specular (0,0) beam one gets a bright-field image. Images taken with any other beam lead to dark-field images. On Si(111) superstructures of (1x1) and (7x7) exist. This leads to different intensities of the (0,0) beam On Si(100) reconstructions of (1x2) and (2x1) exist. Using either the (1/2,0) or the (0,1/2) beam leads to the images in b and c.
Scanning Electron Microscopy (SEM) A primary electron beam with 1 – 10 keV is focused to 1-10 nm and scanned over the surface. The secondary electron yield or other quantities are used to modulate a cathode ray tube (CRT). SEM is basically used to investigate surface topography. SE: Using the secondary electrons (<50 eV) is the most frequent method, it gives the topography. BSE: Inelastic backscattered electrons depend on the atomic number and detection of these allows also elemental mapping. AES: Detection of Auger peaks also allows elemental mapping (Scanning Auger) Sample current can also be measured as function of the scanned primary beam. No detector necessary. X-rays, which are produced can also be used to modulate the CRT. Is more bulk sensitive Electron beam induced current (EBIC) can be measured on semiconductors, pn-junctions.
Scanning Tunneling Microscopy (STM) In this case a sharp metal tip (W, Pt, etc.) is scanned over a surface in close proximity (few Å). The front atom of the tip and the surface atoms are so close that in case of a potential difference a tunneling current is measured. Scanning is performed via piezo ceramics in three axes and with a feedback loop the distance between tip and surface is regulated. This allows the determination of the surface corrugation on the atomic scale. The tunnel current is given by: V: bias voltage D(V): electron density of states d: dip-surface distance Φ: effective barrier height Due to the strong d dependence of j the vertical resolution is about 0.01 Å, the lateral resolution is about 1 Å.
STM is not primary sensitive to atomic positions but rather to the density of electronic states (DOS). With positive bias voltage one probes the DOS of the occupied states below the Fermi level, in case of negative voltage the DOS of empty states are probed. • There are three modes of STM operation: • Constant current mode • Constant height mode • Scanning tunneling spectroscopy (STS) In the case of STS the bias voltage is modulated at any point of the surface, or maps are made with different bias voltage. The quantity (dI/dV)/(I/V) corresponds to the DOS. This technique is also referred to as current-imaging tunneling spectroscopy (CITS). With STS one can get local chemical information. However, in general the evaluation is not straightforward, due to influence of tip-DOS and unknown tunneling transmission between different electron orbitals. STS on a reconstructed Si(111)(7x7) surface
Atomic Force Microscopy (AFM) • In AFM the force between tip and sample is measured. The interatomic force between tip and sample deflect a cantilever which carries the tip. In this case the morphology of conducting, semiconducting and insulating sample surfaces can be measured. • There are several methods to measure the deflection of the cantilever: • Use of an STM to measure the cantilever deflection • Use of optical interferometry • Deflection of a laser beam • Measurement of capacitance between cantilever and a second electrode. • Deflections of 10-2 Å can be measured. • The AFM can be used in three modes: • Contact mode • Non-contact mode • Tapping mode