Download
1 / 18
180 likes | 282 Vues
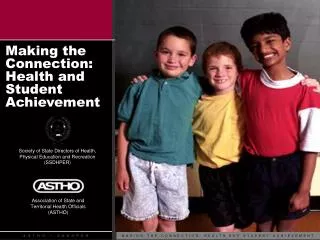
CH 3: Health, Education, Poverty, and the Economy. CH 3 considers relationships between – underlying themes throughout this text/course Health and education Health and poverty Health and equity. Access to quality healthcare is a basic human right. Should not be impacted by; Age Gender

E N D
CH 3 considers relationships between – underlying themes throughout this text/course • Health and education • Health and poverty • Health and equity
Access to quality healthcare is a basic human right • Should not be impacted by; • Age • Gender • Income • Occupation • Political or religious affiliation • ethnicity
So I can't show you how, exactly, health care is a basic human right. But what I can argue is that no one should have to die of a disease that is treatable. Paul Farmer
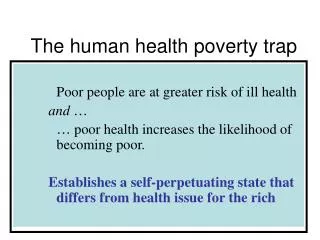
Socioeconomic Context of Disease • SES is a good predicator of health status • Poorer households have limited resources for preventing and treating illness and injury
Good health results in: • more years in the workforce making $ • fewer days missed from work • more productive at work, make more $
Costs associated with illness • health care expenses • treatment, medications • w.o. insuranceor limited $, often delay getting treatment or seek cheaper options -> …. • miss work (or school) – lose pay (more likely to be unsuccessful) • transportation costs to healthcare
Some Low-Income Countries have much better health indicators than their economic peers. • Goal is to learn from these countries
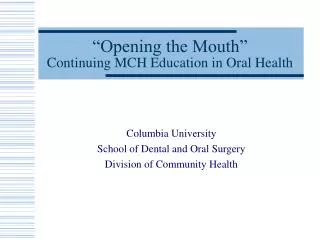
Low Income countries that do well.. • Invest in nutrition, health, and education. • e.g. free primary education, national healthcare system… • Focus on improving people’s knowledge of hygiene and healthcare • washing hands • latrines way from homes and water supply • treating or filtering water • use of oral rehydration solutions to treat diarrheal diseases
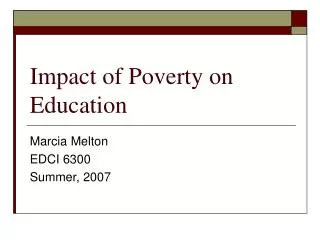
Literacy and higher educational levels are correlated with better health. • Mothers who can read generally have fewer children and healthier children.
National Demographic and Health Study (2003-2004) • Compared no education, primary education, to secondary education or higher • Found a direct relationship between level of education and knowledge of ORS for the treatment of diarrhea • Level of education and under 5 mortality rate were inversely related
Low Income countries that do well.. • Invest in health services and programs that are low cost and high impact • measles vaccinations • bed nets • Have a functional ministry of health
Figure 3.1: Percentage of 1-Year-Old Children Receiving Measles Immunization, by Mothers with No Education and Mothers with Higher Education, for Selected Countries Data from WHO Statistical Information System (WHOSIS). Available at: http://www3.who.int/whosis/core/core_select_process.cfm. Accessed July 10, 2006.
Where a person lives matters…even within a country or region • India – WHO Stats
Figure 3.2: Under-5 Child Mortality Rates, for Selected States, India, 2005-2006 Data from Chapter 7- Infant and Child Mortality. In: International Institute for Population Sciences (IIPS), & Macro International. National Family Health Survey (NFHS-3), 2005-06: India: Vol. 1. Mumbai, India: IIPS; 2007. Available at: http://www.nfhsindia.org/NFHS-3%20Data/VOL-1/Chapter%2007%20-%20Infant%20and%20Child%20Mortality%20(313K).pdf. Accessed November 26, 2010.
Figure 3.3: Infant Mortality Rates, for Selected States, Brazil, 2006 Data from Instituto Brasileiro de Geografia e Estatística (IBGE). Complete Mortality Tables 2006: In 2006, life expectancy at birth of Brazilians was 72.3 years. Rio de Janeiro, Rio de Janeiro: IBGE; 2007. Available at: http://www.ibge.gov.br/english/presidencia/noticias/noticia_impressao.php?id_noticia=1043. Accessed November 27, 2010.
Figure 3.4: Percentage of Children, 0 to 5 Years Who are Stunted, by Location, for Selected Regions Data from UNICEF. Progress for Children: Achieving the MDGs with Equity. Available at: http://www.unicef.org/media/files/Progress_for_Children-No.9_EN_081710.pdf. Accessed September 17, 2010. .