Download
1 / 19
220 likes | 380 Vues
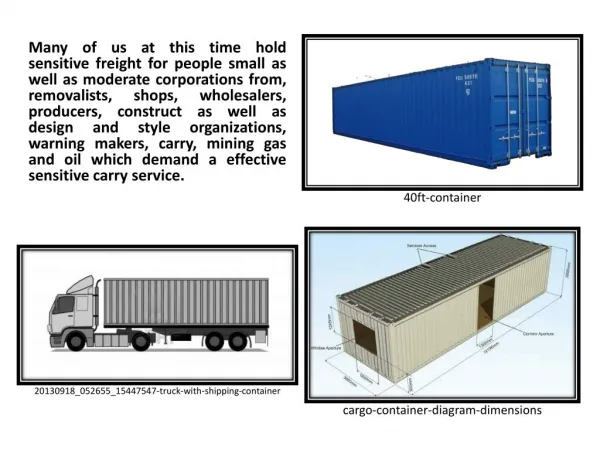
Shipping. World Trade &. The Hull Ins. Market . Some markets have withdrawn. Credit issues with certain underwriters. Inability to capitalize startups. Banks being more careful about underwriters security. Demand. Demand.

E N D
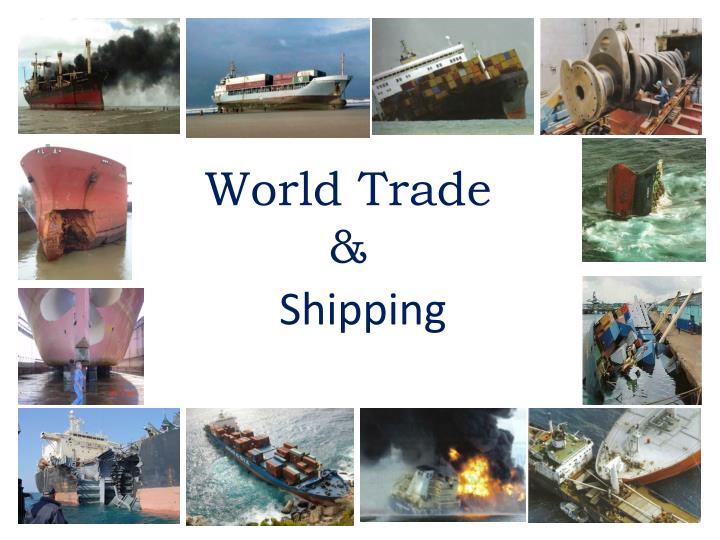
Shipping World Trade &
The Hull Ins. Market • Some markets have withdrawn. • Credit issues with certain underwriters. • Inability to capitalize startups. • Banks being more careful about underwriters security.
Demand • Continues to Increase. Driven by increases in World trade. • Number of vessels and DWT increasing • Freight Rates remain strong for most segments
Demand Growth of World Trade 2001 – 2006 (in million tons) Petroleum Products +12% Dry Bulk +38% Other Cargo +26% Total Trade +30% 2007 – 2012 (projected in million tons) Petroleum Products +17% Dry Bulk +38% Other Cargos +55% Total Trade +35% Source - Clarksons
Demand Growth of World Fleet 2001 – 2006 (Actual Growth in million DWT) Petroleum Products +25% Bulk Carriers +36% Container Carriers +86%* All Vessels +38% 2007 – 2012 (Projected Growth in Million DWT) Petroleum Products + 35% Bulk Carriers + 82% Container Carriers +103% All Vessels + 57% Source – Clarksons / ABS Measured in TEU’s *
Demand Growth of World Fleet 2001 – 2006 (Actual Growth in Number of Vessels Tankers + 20 % Bulk Carriers + 36% Container Carriers + 40% All Vessels + 26% 2007 – 2012 (Projected Growth in number of vessels) Tankers + 17% Bulk Carriers + 66% Container Carriers + 67% All Vessels + 27% Source – Clarksons / ABS Measured in TEU’s *
Demand New Buildings The order books have never been fuller DeliveriesNew OrdersTotal Orderbook 2003 37 77 115 2008 70 100 330 2012 85 115 210 2016 82 90 230 Source –ABS
Demand Demolition & Scrapping
Claims Trends Photo AHIS
Claims Trends • Total Losses • After 20 years of a consistent downward trend, total losses have started to increase • 2006 • 37% increase over ‘05 # of vessels • 40% increase over ‘05 in tonnage
Claims Trends Serious Partial Losses • The rate has increased dramatically: • +270 % in 10 years. • 1998 rate of serious partial losses was 0.64% • 2007 is 1.73%
Claims Trends Escalation of Claims Costs • Turbocharger Replacement • 2002 - $286,000 • 2007 - $425,000 - + 48% • Hull Repair - 300 tons (of Steel) – Far East Yard • 2002 - $1,000,000 • 2007 - $2,100,000 - + 110%
Claims Trends Escalation of Claims Costs For the past 5 years: Claims costs have escalated 8% per year!
Claims Trends Reasons for Escalation: • Lack of yard space • Just in time inventory • Larger more complex main engines • Increased cost of steel • Depreciating US Dollar • “Yard Bonus” for timely completion.
Summary • The world fleet continues to grow. • 50% - 60% in 10 years. • The number of large & total losses are increasing. • 150% in 10 years. • The loss costs are increasing. • 8% per year in 5 years. Service providers are busy