Download
1 / 28
280 likes | 444 Vues
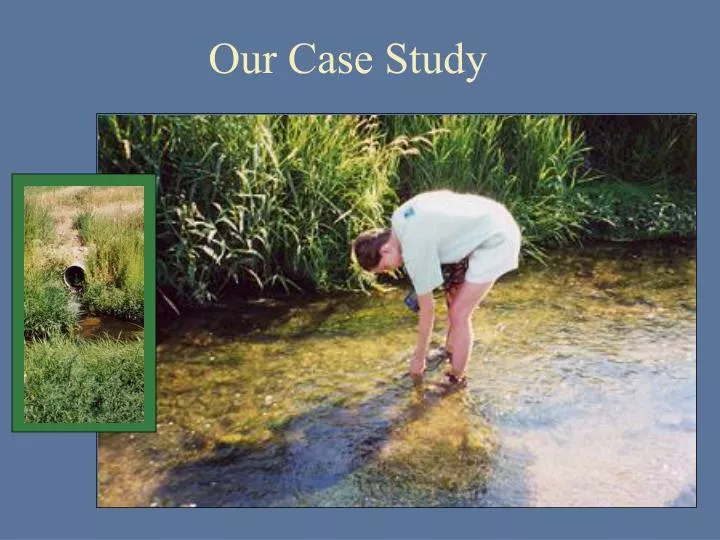
Our Case Study. Rationale for study. The TMDL model assumes that there is no decrease in seepage during low flow conditions, basing its calculations on a standard amount of seepage that is independent of rainfall.

E N D
Rationale for study • The TMDL model assumes that there is no decrease in seepage during low flow conditions, basing its calculations on a standard amount of seepage that is independent of rainfall. • But, there are no previous field tests of these seepage assumptions in the St. Vrain • Low-flow conditions minimize non-point inputs, allowing: • isolation of groundwater seepage • characterization of seepage chemistry • because any change in flow or chemistry should be due to seepage, given that there is minimal to zero runoff. • These should be perfect conditions in which to study seepage!
Research Questions 1. a) Can we identify seepage into these streams? b) Can we link seepage to changes in water chemistry? 2. What are the observable effects of wastewater treatment plant effluents in these streams? ?
Sample Parameters On-site: - flow - temperature - conductivity - dissolved oxygen (DO) In the lab: - pH - phosphorus - ammonia - nitrate
Selecting Sample Sites We chose sample sites based on the following criteria: • Reaches without external hydrologic influences (no inputs other than seepage) • Unusually low flow, as indicated by USGS monitoring stations • Feasible to access
St. Vrain Creek below Longmont Discharge (ft3/sec) • Unusually low flow, as indicated by USGS monitoring stations
Study Sites St. Vrain Creek Boulder Creek Coal Creek
Research Questions 1. a) Can we identify seepage into these streams? b) Can we link seepage to changes in water chemistry? 2. What are the observable effects of wastewater treatment plant effluents in these streams?
Boulder Creek Flow The reaches highlighted in yellow have no external inputs, and are analyzed for possible effects of seepage.
Coal Creek Flow Known inputs and outtakes are labeled. Again, analysis for seepage is focused on the matched pairs highlighted in yellow. Coal Creek ditch Erie discharge Lafayette discharge Rock Creek
St. Vrain Flow Highlighted segment is isolated for analysis of seepage inputs. Last Chance Ditch Boulder Creek Dry Creek Longmont discharge Left Hand Creek
St. Vrain Creek Boulder Creek Coal Creek Observed vs. Expected Seepage Red lines are seepage expected based on 10 years of data. Blue bars are observed seepage. Overall, seepage was very low and, in cases such as the St. Vrain Creek, much lower than expected.
Change in Conductivity Seepage should have increased conductivity, but we did not see a universal positive percent change. Thus, there is no consistent pattern that we can attribute to the effect of groundwater seepage.
Change in Water Chemistry Groundwater additions should have caused a dilution, or negative percent change in water chemistry. But, as the graph shows, there is no clear, consistent effect of groundwater seepage.
Seepage Conclusions • a) Can we identify seepage into these streams? • b) Can we link seepage to changes in water chemistry? YES, BUT OVERALL SEEPAGE IS VERY LOW. In fact, observed seepage is much lower than the expected values based on 10-year records. NO Probably due to very low amounts of seepage
Research Questions 1. a) Can we identify seepage into these streams? b) Can we link seepage to changes in water chemistry? 2. What are the observable effects of wastewater treatment plant effluents in these streams?
Coal Creek Flow Coal Creek ditch Louisville discharge Erie discharge Lafayette discharge Rock Creek The red inputs are discharges from wastewater treatment plants.
These graphs show the levels of ammonia and nitrate at the sample points along the creeks, in regards to the position of wastewater discharges. Effluent in Coal Creek Lafayette Erie Louisville Ammonia - note the increase below Erie treatment plant, which discharges all waste as ammonia, not using a process of nitrification. Nitrate – note the increase after Louisville and Lafayette treatment plants which turn ammonia waste into nitrate through nitrification.
St. Vrain Flow Last Chance Ditch Boulder Creek Dry Creek Longmont discharge Left Hand Creek
Again, these show the levels of ammonia and nitrate at the sample points along the St. Vrain, in regards to the position of the wastewater discharge. Effluent in St. Vrain Longmont Ammonia – note the increase in ammonia after the Longmont treatment plant. Nitrate – note the increase after the Longmont treatment plant. This spike inn nitrate is the result of incomplete treatment and biological processes.
Effluent Conclusions 2. What are the observable effects of wastewater treatment plant effluents in these streams? CHANGES IN WATER CHEMISTRY Observed changes in ammonia and nitrate concentrations that can be linked to method of wastewater treatment
The St. Vrain TMDL Ammonia profile using seepage assumptions from 10-year record. The blue line is the amount of unionized ammonia in the water, the red line is the acute limit. The blue line is well below the red.
Implications of a Revised Model Model generated using the new assumption of zero seepage, such as might be concluded based on our observations. Note that the blue line is now above the red, indicating a potential health and safety risk. Compliance would now require a 20% reduction in effluent ammonia, which could be very expensive to actually do.
Conclusions • Seepage may be sensitive to changes in climate and associated factors, given that during a drought the seepage was lower than expected. • The TMDL model is based on assumptions that do not match observations about seepage. • Conclusions based on model assumptions should be tested for robustness during drought conditions, to ensure that the model reflects the actual conditions. Persistently low seepage could affect future modeling results and costly regulatory decisions
Drought and Climate Change Basic assumption: Global warming = surface water volume due to temperatures and evapotranspiration CO2
Changes resulting from a warmer-dryer climate • Increased eutrophication and anoxia due to inceased photosynthes, higher consumption of oxygen • Changes in nutrient cycling • Ex: the rate of nitrification is temperature-dependent • Changes in chemical concentration • Low stream volume might actually increase the concentration of chemicals in the water. • A longer residence time (time spent in solution) and increased biological uptake might actually result in a dilution of chemicals.
Management Implications • Small changes in climate = large changes in magnitude of hydrologic events • Must not ignore discrepancies observed between models and reality that are highlighted during periods of extreme variability • Maintaining water quality in a more variable future may require more stringent regulations and investing in more stringent treatment facilities
Acknowledgements Thanks to: Dr. James Saunders The staff of the CU-CIRES Limnology lab Dr. William Lewis Alison and Carol, for transportation assistance