Download
1 / 47
470 likes | 683 Vues
Radar Data Assimilation in the Simulation of Mesoscale Convective Systems. Seoul National University Dong-Kyou Lee, Hyun-Ha Lee, Jo-Han Lee, Joo-Wan Kim. CONTENTS. 1. Introduction 2. Heavy Rainfall Case 3. Tunings of 3DVAR for Radar Data

E N D
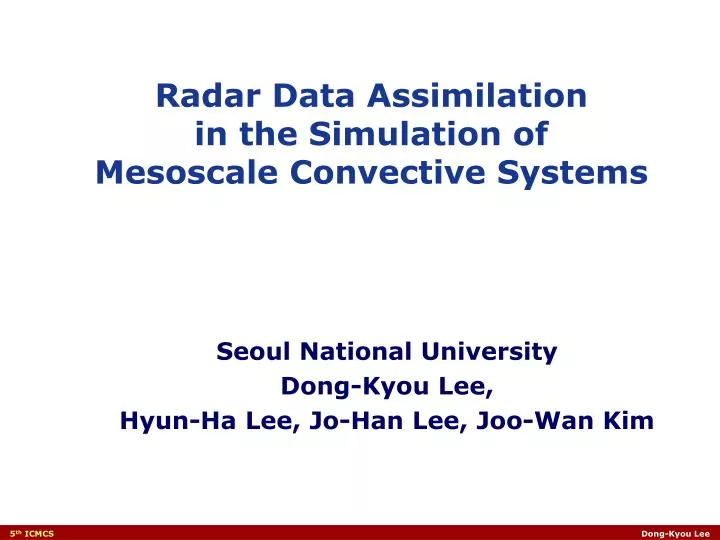
Radar Data Assimilation in the Simulation of Mesoscale Convective Systems Seoul National University Dong-Kyou Lee, Hyun-Ha Lee, Jo-Han Lee, Joo-Wan Kim
CONTENTS 1. Introduction 2. Heavy Rainfall Case 3. Tunings of 3DVAR for Radar Data 4. Radar Data Assimilation and Model Experiments 5. Summary and Conclusions
INTRODUCTION • Heavy rainfall is one of the major severe weathers over East Asia producing devastating flash flood, and consequently causing fatalities and property damage. Heavy rainfall is usually resulted from individual mesoscale storms or mesoscale convective systems (MCSs) embedded in synoptic-scale disturbances (Kim and Lee, 2006). • In order to understand the evolution and development mechanisms of mesoscale convective storms responsible for heavy rainfall and better predict heavy rainfall events, high-resolution observations and data assimilation techniques are important components. • Radar data assimilation is a key scientific issue in numerical weather prediction of convective systems for very short-range forecasting (Wilson et al., 1998). In recent years considerable progress has been made in the assimilation of radar observations into convective-scale numerical models for heavy rainfall prediction, and the assimilation of radar rainfall estimates.
OBJECTIVES • The objective of this study is to investigate very short-range forecasting of the WRF model through the 3DVAR data assimilation of Dual-Doppler radar data (radial velocity and reflectivity) for a heavy rainfall case accompanying mesoscale convective systems (MCSs) over the Korean Peninsula. • The WRF 3DVAR system is modified by tuning scale lengths and observation error statistics. The increment analysis update (IAU) and the rapid update cycle (RUC) are performed using radar data in the modified 3DVAR system. • With the characteristics of radar data for the period of MCSs development, sensitivity tests of assimilation window and updated frequency are investigated.
HEAVY RAINFALL CASE (24~25 July 2003) 850 hPa 12UTC 24 July 2003 850 hPa 00UTC 25 July 2003
RADAR REFLECTIVITY 24/2100 UTC 24/2130 UTC 25/2200 UTC 25/2230 UTC 24/2300 UTC 24/2330 UTC 25/0000 UTC 25/0030 UTC 25/0100 UTC 25/0130 UTC 25/0200 UTC 25/0230 UTC
22 23 01 02 03 00 25 Jul 6-h accumulated and hourly rainfall Sang-Ju (62.0 mm/6 hr) Dae-Gu (53.2 mm/6 hr) Jeon-Ju (96.7 mm/6 hr)
Skew T-Log P DIAGRAM Gwangju 2418 UTC Gwangju 2500 UTC CAPE : 8 J/Kg LFC : 1012 m AGL CAPE : 1080 J/Kg LFC : 764 m AGL CAPE rapidly increased for 6 hours from 18 UTC 24 to 00 UTC 25 July. Mesoscale convective systems with 3 convective cells developed in this unstable environment.
RADAR DATA • Radar position • Radar Information
5.5 km 4.5 km 5.0 km 3.0 km TIME-LAGGED AUTOCORRELATION OF REFLECTIVITY AND RADIAL VELOCITY 21 UTC 24 – 01 UTC 25 July 2003 (6min interval) 3.0 km : 6 points 4.5 km : 6 points 5.0 km : 14 points 5.5 km : 16 points 42 sequential data points of reflectivity and radial velocity for 6 hours were obtained.
5.5 km 5.0 km 4.5 km 3.0 km RESULT OF AUTOCORRELATION Radial Velocity For the 42 data points Reflectivity
RESULT OF AUTOCORRELATION Correlation Minute Vr Ref τ Average of the 42 data points Radial velocity (Vr) had a longer autocorrelation time scale than that of reflectivity. The autocorrelations dropped to zero before 30 minutes. Update frequency smaller than 60 minutes (2 x τ) might be used for radar data assimilation, especially for RUC and IAU.
DATA ASSIMILATION SYSTEM Tuning of 3DVAR (Version 2.1) and a radar data assimilation system • The scale lengths of background error (currently about 110 km for wind and 40 km for mixing ratio) were estimated for high resolution radar observations. • The average minimization ratio (about 25 %) of the cost function allowed further minimization to be possible by adjusting the observation errors. • A radar data assimilation system for Increment Analysis Update (IAU) and Rapid Update Cycle (RUC) with 3DVAR was developed.
TUNING OF BACKGROUND SCALE-LENGTH The O-B (observation – background values) of radar data was calculated from two MCS cases and one frontal case. The O-B correlation decreased in short distance. It means that the radar observation can detect short-term scale phenomena. The locality of the radar reflectivity was higher than that of radical velocity O-B Statistics
SCALE LENGTHS radial velocity reflectivity 9 km 4 km - The locality of the radar observation can be reflected by tuning the scale length of the background error against a recursive filter. - 9 km and 4 km of scale lengths are proper for radial velocity and reflectivity, respectively.
The expectation value of the minimized cost function is given by a half of the effective number of observations (Desroziers and Ivanov, 2001). Further minimization of the cost function can be made by scaling a cost function term to satisfy the expectation value of the minimized cost function. The adjustment of scaling parameters are done by iteration. ERROR TUNING IN 3DVAR
To adjust the real cost function to the expectation value, scaling parameters (or error factors) will be applied to each cost function term and to each observation type, and determined iteratively. where i means iteration number. The estimation of and (Desroziers and Ivanov, 2002). 3DVAR ERROR TUNING
3DVAR ERROR FACTORS The numbers of effective radar radial velocity and reflectivity observations are 16,820 and 26,977, respectively, and the tuning parameters of the observation error converge rapidly.
IMPACT OF TUNING ON MINIMIZATION J/p for ideal: 0.5 J/p for un-tuned: 1.38 J/p for tuned: 0.53 The decrease in the cost function of the un-tuned 3DVAR and the tuned 3DVAR is 25 % and 64 %, respectively. In particular, the ratio of the minimized cost function (J) and the number of used observation (p) is 1.38 and 0.53 for the un-tuned 3DVAR and the tuned 3DVAR, respectively.
EXPERIMENTS • 3-hr assimilation period with 1-hr update frequency for 6-hr forecast • Three initialization experiments are performed. - CON : IAU with un-tuned 3DVAR increments - RUC : RUC with tuned 3DVAR results - IAU : IAU with tuned 3DVAR increments
INITIALIZATION EXPERIMENTS 24 JUL 18 UTC 25 JUL 00 UTC 19 UTC 20 UTC 21 UTC 22 UTC 23 UTC 01 UTC 02 UTC 03 UTC The 3 cycles are performed with 1-h intervals for a 3-h assimilation window RUC IAU 6 h forecast CON 3DVARAnalysis 3DVARAnalysis 3DVARAnalysis 3DVARAnalysis 3DVAR Analysis 3DVAR Analysis 3DVAR Analysis Grid nudging Grid nudging 3DVAR Analysis Grid nudging
6-h ACCUMULATED RAINFALL AMOUNT CON OBS 224.9 96.7 RUC IAU 114.5 96.9
Radar Reflectivity (dbz) CON OBS IAU RUC
RMSEs of radial velocity The tuning of 3DVAR results in improvement in the forecast of wind field. The improvement is effective up to 4-hour forecast.
3 . SENSITIVITY OF ASSIMILATION WINDOW AND UPDATE FREQUENCY
EXPERIMENTS 1) UPDATE FREQUENCY 2) ASSIMILATION WINDOW
SENSITIVITY EXPERIMENTS 24 JUL 18 UTC 25 JUL 00 UTC 19 UTC 20 UTC 21 UTC 22 UTC 23 UTC 01 UTC 02 UTC 03 UTC 1H_12MIN 1H_30MIN 3H_12MIN 3H_30MIN 3H_60MIN WINDOW_FREQUENCY
RMSEs OF RADIAL VELOCITY • Assimilation window was more effective than update frequency. • 30-min update frequency had smaller RMSE during MCSs development. • The 3-h assimilation window and 30-min update frequency was relatively better.
6-h ACCUMULATED RAINFALL AMOUNT 3H_12M 3H_30M 78.8 143.2 1H_12M 1H_30M 117.6 79.9
SUMMARY AND CONCLUSION • In this study, radar data had much shorter scale-lengths in 3DVAR compared to the typical synoptic observations. The scale length of 9 km for radial velocity, and 4 km for reflectivity were used. • The error for radial velocity (2 m/s) was overestimated (70 % of the currently used error), and that for reflectivity (5 dBZ) was underestimated (190 % of the currently used error). Using the error factors led a rapid converge of radar data assimilation in one iteration. • In the radar data assimilation, the 3DVAR tuned by the error factors improved the maximum rainfall amount that was in better agreement with observation than that of the un-tuned 3DVAR. The RMS errors of radial velocity simulated by the tuned 3DVAR (RUC and IAU) were also smaller than that of the un-tuned 3DVAR. • The time-lagged autocorrelation of radar radial velocity and reflectivity during the period of the storm development was about 30 min and less than 30 min, respectively. In the IAU the 30-minute update cycles was better compared to other update cycles in this study. • In the 3DVAR assimilation using radar data, the assimilation window was more sensitive to the simulation of heavy rainfall than the update frequency.
AWS WIND FIELD 0030 UTC 0020 UTC 0040 UTC 0050 UTC 0100 UTC 0110 UTC Strong convergence formed by downdraft occurred with previous storm.
3.0 km : 38 points 3.5 km : 24 points 4.0 km : 47 points 4.5 km : 95 points 5.0 km : 133 points 5.5 km : 128 points 5.5 km 3.5 km 4.5 km 5.0 km 3.0 km 4.0 km RADAR DATA 3 hours 465 Points
Ref Vr AUTOCORRELATION 465 data points More data points had a shorter time period, and did not much change the characteristics of the autocorrelation.
GRID NUDGING AND IAU IN WRF • For the grid nudging, we have implemented time-variant nudging (=1) and target nudging (=3) • Surface (in planetary boundary layer) nudging (or IAU) is not yet implemented. • The nudging of U, V, and T is currently tested. Nudging IAU
TIME-HEIGHT SECTION Area-mean u- and w- wind IAU RUC CON U W