Download
1 / 63
630 likes | 823 Vues
The SLAMM Model (Sea Level Affecting Marshes Model ). Jonathan Clough. 3-18-2014. Warren Pinnacle Consulting, Inc. Founded in 2001 Located in Central VT, Environmental Modeling Experts Jonathan S. Clough, Founder, Environmental Consultant since 1994

E N D
The SLAMM Model(Sea Level Affecting Marshes Model) Jonathan Clough 3-18-2014
Warren Pinnacle Consulting, Inc. Founded in 2001 Located in Central VT, Environmental Modeling Experts Jonathan S. Clough, Founder, Environmental Consultant since 1994 Dr. Amy Polaczyk, SLAMM modeler, with us since 2010 Dr. Marco Propato, Accretion modeling expert, joined in 2011 warrenpinnacle.com warrenpinnacle.com/quals.pdf
SLAMMSea Level Affecting Marshes Model • Simulates the dominant processes involved in wetland conversions under different scenarios of sea level rise • inundation, erosion, accretion, soil saturation and barrier island overwash • Uses a complex decision tree incorporating geometric and qualitative relationships to represent transfers among coastal classes • Can provide numerical and map-based output with minimal computational time 2009 2100, 1 m SLR
SLAMM “Uncertainty Cloud” for Selected Region • Modest data requirements allowapplication to many sites at a reasonable cost • Integrated stochastic uncertainty and parameter sensitivity analyses • Provides a range of possible outcomes and their likelihood • Users have included US EPA, USGS, The Nature Conservancy, National Wildlife Federation, and the U.S. Fish & Wildlife Service, among others • Calibrated to historic SLR in Louisiana • The model has been applied to more than 100 National Wildlife Refuges in the US http://warrenpinnacle.com/prof/SLAMM The Range Between 5th and 95th percentiles is graphed along with mean and deterministic results
Model Development Overview Intermittently under development since 1985, Park & Titus Three Year EPA STAR grant (2005-2008) provided funds for significant model development. Simulations of entire Georgia and South Carolina Coastline Model assumptions closely re-examined by team of scientists Survey of recent literature Model tested using LIDAR data Model results linked to ecosystem services National Wildlife Federation Funded Simulations Florida, Puget Sound, Chesapeake Bay, Louisiana (Glick et al, 2013) USFWS funding of refuge simulations Over 100 refuges completed to date in USFWS Regions 4,5,8 TNC / GOMA funding of Gulf of Mexico Simulations
Latest Version SLAMM 6.2 64-bit (parallel processing in-house) Dynamic Accretion Open Source Elevation Analyses with histograms Increased Flexibility in Parameterization. Upgrade of Salinity Component (Bathymetry) Users Manual & Technical Documentation Update
Coming Soon – SLAMM 6.3 and 6.4 • SLAMM 6.3 – USGS Sponsored • Salinity linkages • SAV model • SLAMM 6.4 – USFWS Sponsored • Roads and Infrastructure module
Ongoing Work on SLAMM Model • Gulf Coast Prairie LCC • “Gap Analysis:” filling in all holes in the Gulf of Mexico • NY State – Application to Long Island, NY City, Hudson River • Examine the effects of DEM processing and “hydro enforcement” • All CT coasts • USGS:OR – SLAMM 6.3. Linkages created to EPA salinity models. SAV predictions • Habitat switching based on salinity, model testing and documentation • Ducks Unlimited – Pacific Northwest • Application of uncertainty analysis in WA & OR, evaluating land parcels for restoration • TNC TX – Examine effects on infrastructure given development and restoration scenarios • Dike model refined to assess likelihood of overtopping • Alternative green/grey infrastructure design.
Model Process Overview Addresses Six Primary Processes (Inundation, Erosion, Saturation, Overwash, Accretion, Salinity) Titus and Wang 2008
Model Process Overview • Inundation:Calculated based on the minimum elevation and slope of the cell. • Erosion:Triggered given a maximum fetch threshold and proximity of the marsh to estuarine water or open ocean. • Accretion:Vertical rise of marsh due to buildup of organic and inorganic matter on the marsh surface. Rate differs by marsh-type. • Salinity: Optional model or linkage to existing model. Salinity affects habitat switching in areas with significant freshwater flows • Overwash:Barrier islands undergo overwash at a fixed storm interval. Beach migration and transport of sediments are calculated. • Saturation:Migration of coastal swamps and fresh marshes onto adjacent uplands-- response of the water table to rising sea level.
Conceptual Model • Square “raster” cells with elevation, slope, aspect, estimated salinity, wetland type • Cells may contain multiple land-types • Cell size flexible given size of study area Dry Land Various Wetlands Open Water 2D Representation 3D Representation
SLAMM Inundation Model Equilibrium Approach Elevation Land Elevation Salt Elev. (30 day inundation) Salt Boundary MHHW MTL MLW Regularly- Flooded Marsh (Often Salt Marsh) Inland Fresh and Dry Land Tidal Flat Transitional or Irregularly- Flooded Marsh Distance Inland
SLAMM Inundation Model(Migration of Wetlands Boundaries due to Sea Level Rise) Elevation Old Land Elevation New Land Elevation Salt Elev. (30 day inundation) Salt Boundary MHHW MTL MLW Tidal Flat Regularly- Flooded Marsh (Often Salt Marsh) Inland Fresh and Dry Land Irregularly- Flooded Marsh Water Distance Inland
Feedbacks to Accretion • SLAMM 6 Allows for Elevation Feedbacks to Accretion as shown by Morris et al. (2002) • Linkage to Morris MEM model “Unstable Zone” High-elevation marsh subject to less flooding
Linkage to Marsh Equilibrium Model • Explicitly accounts for physical and biological processes affecting marsh accretion http://129.252.139.114/model/marsh/mem2.asp
Detailed SLAMM Land Categories • 26Categories, often derived from NWI (National Wetlands Inventory) • May be specified as “protected by dikes or seawalls” Dry Land:Developed and Undeveloped Swamp:General, Cypress, & Tidal Transitional Marsh:Occasionally Inundated, Scrub Shrub Marsh:Salt, Brackish, Tidal Fresh, Inland Fresh, Tall Spartina Mangrove:Tropical Settings Only Beach:Estuarine, Marine, Rocky Intertidal Flats:Tidal Flats & Ocean Flats Open Water:Ocean, Inland, Riverine, Estuarine, Tidal Creek
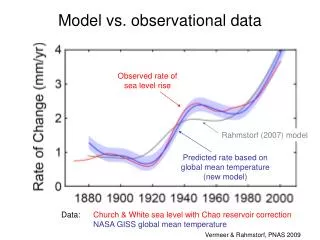
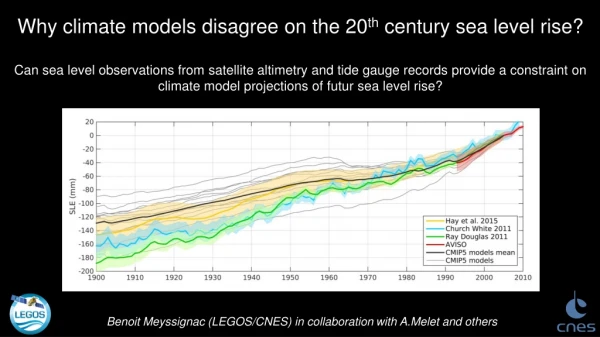
Sea Level Rise Scenarios • Model incorporates IPCC Projections as well as fixed rates of SLR • Global (Eustatic)Rates of SLR are correctedfor local effects using long-term tide gauge trendsor spatial subsidence Grinsted, 2009Clim. Dyn. Vermeer and Rahmstorf, 2009, Proceedings of the National Academy of Sciences
Powerful SLAMM Interface – Main Interface (Illustrates 3-D Graphing Capabilities)
Connectivity Component • Method of Poulter & Halpin 2007 • Assesses whether land barriers or roads prevent saline inundation • Can be used for levee overtop model with fine-scale DEM
Built-in Sensitivity Analyses • Marshes most sensitive to accretion rates • Beaches and Tidal flats most sensitive to parameters that affect SLR rates, tide ranges, and initial condition elevations • Dry land most sensitive to SLR rates.
Uncertainty Module Addresses Two Primary Criticisms • Accretion Model • Doesn’t account for feedbacks (not true in SLAMM 6) • Manner in which feedbacks are accounted for is uncertain • Lack of uncertainty evaluation • How confident are you of the results? • Interpretation of deterministic results difficult • What to do if available input parameters are not very good? • Decision making difficult since likelihood and outcome variability are unknown
Parametric Model Input Distributions Model Output Distributions “Uncertainty Cloud” for Selected Region • Examining SLAMM results as distributions can improve the decision making process • Results account for parametric uncertainties • Range of possible outcomes and their likelihood • Robustness of deterministic results may be evaluated
Dike Considerations • Traditional SLAMM has “on-off” dike layer • Option to model dike elevations is included • New: Dike elevations may be input at fine scale • Connectivity can be used to calculate dike overtop • Dike Removal • Dynamic accretion processes following dike removal are not represented
“Hindcasting” Capability • Run the model with historical data for validation and calibration • Results will be imperfect • Historical elevation data with high vertical resolution unavailable • Historical land-cover data are spotty and changes in NWI classification have occurred • Model will not predict land-use changes, beach nourishment or shoreline armoring • For many sites, hindcasting is not possible due to insignificant RSLR “signal” • In GOM, land subsidence amplifies SLR signal enough to make hindcasting possible
SLAMM Infrastructure Module • Grant funded by US Fish and Wildlife Service • Integrates predicted SLR and tide-ranges with roads and infrastructure databases • Predicts effects on infrastructure • Better captures infrastructure effects on surrounding wetlands
SLAMM Erosion Model • Erosion assumed a function of wave action • Maximum Fetch calculated at each cell based on previous land-changes. • When threshold of 9km is exceeded horizontal erosion rates are implemented. • 9 km threshold based on visual inspection of maps • Value verified within literature (Knutson et al., 1981) • Tidal Flats have different assumptions
Overwash Assumptions • Barrier islands of under 500 meter width are identified and assumed to be affected • Frequency of “large storms” is user input • Assumed effects are professional judgment based on observations of existing overwash areas (Leatherman and Zaremba, 1986). • Effects editable in SLAMM 6
Soil Saturation • SLAMM estimates (fresh) water table from the elevation nearby swamps or fresh-water wetlands • As sea levels rise, this applies pressure to fresh water table (within 4km of open salt water) • Model results could include “streaking” as a result of soil saturation predictions. Water Table Rise Near Shore, Based on Carter et al., 1973
SLAMM Salinity Model • Required as marsh-type is more highly correlated to salinity than elevation when fresh-water flow is significant (Higinbotham et. al, 2004) • Simple steady-state salinity model; not hydrodynamic • Adds complexity to model development • Requires additional model specifications • Estuary Geometry • Freshwater flow and projections • Linkages to external salinity models are already built in to SLAMM 6.3
SLAMM 5 Salinity Component (For cells defined as “in-estuary”) Salinity calculated as a function of estuary width, tide range, fresh-water flows, and bathymetry Elevation FWH, fn of River Discharge Fresh Water Tide Range + SLR Salt Water Brackish Tidal Fresh Tidal Swamp SaltMarsh Estuary Area, Moving Inland salinity decreasing, but not linearly
Salinity Calibration • Successfully calibrated to 5 GA estuaries • Good match of salinity to river mile vs LMER data • Publication pending • Spatially calibrated to salinity data in Port Susan Bay, WA
Next Steps in Model Development • Make “flow-chart” of habitat switching and land-categories modeled completely flexible (international applications) • Linkage to hydrodynamic, sediment transport models • More salinity testing • Wider testing of SAV module • Model evaluation and refinement – erosion, overwash, soil saturation • Seeking collaborative partners
Galveston Bay • Hindcast and Initial Forecast Results • Meeting with Stakeholders in TX • Incorporation of & Response to Stakeholder Comments • Final results available at GOMA and SLAMMView website • http://www.slammview.org/slammview2/reports/Galveston_Report_6_30_2011_w_GBEP_reduc.pdf
Complicating Factor: Subsidence • Spatial maps used in hindcasting • Used to convert eustatic to local SLR • Held constant over simulation Gabrysch and Coplin 1990
Different Footprint • Fresh Marsh Expansion 2009 1979
Fresh Marsh Expansion • Anthropogenic Actions 2009 Pred. 2009 Obs.